class: center, middle, inverse, title-slide .title[ # CS&SS 569 Visualizing Data and Models ] .subtitle[ ## Lab 4: advanced ggplot2 ] .author[ ### Brian Leung ] .institute[ ### Department of Political Science, UW ] .date[ ### 2024-01-26 ] --- ## Introduction - Focus on small multiple in `ggplot2` -- - Visualize many panels, or many models -- - When to use `facet_grid()` vs. `facet_wrap()` -- - Use juxtaposition thoughtfully to facilitates comparison -- - Continue to exploit `scale_...()` and introduce new packages such as `ggstance` --- ## Many panels: Nobel prize winners - Dataset taken from this [#TidyTuesday](https://github.com/rfordatascience/tidytuesday/tree/master/data/2019/2019-05-14) project -- - Each row is an individual winner of Nobel Prize -- - Key variables includes: variable | description --------| ----------- prize_year |Year that Nobel Prize was awarded category |Field of study/category laureate_id |ID assigned to each winner full_name |name of the winner gender |character binary gender of the winner organization_country |character organization country prize_share |Share eg 1 of 1, 1 of 2, 1 of 4, etc --- count: false ## Many panels: Nobel prize winners .panel1-nobel1-auto[ ```r *library(tidyverse) ``` ] .panel2-nobel1-auto[ ] --- count: false ## Many panels: Nobel prize winners .panel1-nobel1-auto[ ```r library(tidyverse) *library(lubridate) ``` ] .panel2-nobel1-auto[ ] --- count: false ## Many panels: Nobel prize winners .panel1-nobel1-auto[ ```r library(tidyverse) library(lubridate) *library(RColorBrewer) ``` ] .panel2-nobel1-auto[ ] --- count: false ## Many panels: Nobel prize winners .panel1-nobel1-auto[ ```r library(tidyverse) library(lubridate) library(RColorBrewer) *library(ggrepel) ``` ] .panel2-nobel1-auto[ ] --- count: false ## Many panels: Nobel prize winners .panel1-nobel1-auto[ ```r library(tidyverse) library(lubridate) library(RColorBrewer) library(ggrepel) *library(ggstance) ``` ] .panel2-nobel1-auto[ ] --- count: false ## Many panels: Nobel prize winners .panel1-nobel1-auto[ ```r library(tidyverse) library(lubridate) library(RColorBrewer) library(ggrepel) library(ggstance) *library(scales) ``` ] .panel2-nobel1-auto[ ] --- count: false ## Many panels: Nobel prize winners .panel1-nobel1-auto[ ```r library(tidyverse) library(lubridate) library(RColorBrewer) library(ggrepel) library(ggstance) library(scales) *nobel <- read_csv("data/nobel.csv") ``` ] .panel2-nobel1-auto[ ] --- count: false ## Many panels: Nobel prize winners .panel1-nobel1-auto[ ```r library(tidyverse) library(lubridate) library(RColorBrewer) library(ggrepel) library(ggstance) library(scales) nobel <- read_csv("data/nobel.csv") *head(nobel) ``` ] .panel2-nobel1-auto[ ``` # A tibble: 6 × 7 prize_year category laureate_id full_name gender organization_country <dbl> <chr> <dbl> <chr> <chr> <chr> 1 1901 Physics 1 Wilhelm Conrad … Male Germany 2 1901 Chemistry 160 Jacobus Henricu… Male Germany 3 1901 Medicine 293 Emil Adolf von … Male Germany 4 1901 Peace 462 Jean Henry Duna… Male <NA> 5 1901 Peace 463 Frédéric Passy Male <NA> 6 1901 Literature 569 Sully Prudhomme Male <NA> # ℹ 1 more variable: prize_share <chr> ``` ] <style> .panel1-nobel1-auto { color: black; width: 88.2%; hight: 32%; float: top; padding-left: 1%; font-size: 80% } .panel2-nobel1-auto { color: black; width: 9.8%; hight: 32%; float: top; padding-left: 1%; font-size: 80% } .panel3-nobel1-auto { color: black; width: NA%; hight: 33%; float: top; padding-left: 1%; font-size: 80% } </style> --- count: false ## Many panels: Distribution of Nobel prize winners .panel1-nobel2-auto[ ```r # select top 5 countries *nobel ``` ] .panel2-nobel2-auto[ ``` # A tibble: 881 × 7 prize_year category laureate_id full_name gender organization_country <dbl> <chr> <dbl> <chr> <chr> <chr> 1 1901 Physics 1 Wilhelm Conrad… Male Germany 2 1901 Chemistry 160 Jacobus Henric… Male Germany 3 1901 Medicine 293 Emil Adolf von… Male Germany 4 1901 Peace 462 Jean Henry Dun… Male <NA> 5 1901 Peace 463 Frédéric Passy Male <NA> 6 1901 Literature 569 Sully Prudhomme Male <NA> 7 1902 Physics 2 Hendrik Antoon… Male Netherlands 8 1902 Physics 3 Pieter Zeeman Male Netherlands 9 1902 Chemistry 161 Hermann Emil F… Male Germany 10 1902 Medicine 294 Ronald Ross Male United Kingdom # ℹ 871 more rows # ℹ 1 more variable: prize_share <chr> ``` ] --- count: false ## Many panels: Distribution of Nobel prize winners .panel1-nobel2-auto[ ```r # select top 5 countries nobel %>% * count(organization_country) ``` ] .panel2-nobel2-auto[ ``` # A tibble: 29 × 2 organization_country n <chr> <int> 1 Alsace (then Germany, now France) 1 2 Argentina 2 3 Australia 5 4 Austria 6 5 Belgium 5 6 Canada 7 7 China 1 8 Czechoslovakia 1 9 Denmark 8 10 Finland 1 # ℹ 19 more rows ``` ] --- count: false ## Many panels: Distribution of Nobel prize winners .panel1-nobel2-auto[ ```r # select top 5 countries nobel %>% count(organization_country) %>% * drop_na() ``` ] .panel2-nobel2-auto[ ``` # A tibble: 28 × 2 organization_country n <chr> <int> 1 Alsace (then Germany, now France) 1 2 Argentina 2 3 Australia 5 4 Austria 6 5 Belgium 5 6 Canada 7 7 China 1 8 Czechoslovakia 1 9 Denmark 8 10 Finland 1 # ℹ 18 more rows ``` ] --- count: false ## Many panels: Distribution of Nobel prize winners .panel1-nobel2-auto[ ```r # select top 5 countries nobel %>% count(organization_country) %>% drop_na() %>% * slice_max(order_by = n, n = 5) ``` ] .panel2-nobel2-auto[ ``` # A tibble: 5 × 2 organization_country n <chr> <int> 1 United States of America 341 2 United Kingdom 89 3 Germany 66 4 France 36 5 Switzerland 21 ``` ] --- count: false ## Many panels: Distribution of Nobel prize winners .panel1-nobel2-auto[ ```r # select top 5 countries nobel %>% count(organization_country) %>% drop_na() %>% slice_max(order_by = n, n = 5) %>% * pull(organization_country) ``` ] .panel2-nobel2-auto[ ``` [1] "United States of America" "United Kingdom" [3] "Germany" "France" [5] "Switzerland" ``` ] --- count: false ## Many panels: Distribution of Nobel prize winners .panel1-nobel2-auto[ ```r # select top 5 countries nobel %>% count(organization_country) %>% drop_na() %>% slice_max(order_by = n, n = 5) %>% pull(organization_country) -> * top5_country ``` ] .panel2-nobel2-auto[ ] <style> .panel1-nobel2-auto { color: black; width: 88.2%; hight: 32%; float: top; padding-left: 1%; font-size: 80% } .panel2-nobel2-auto { color: black; width: 9.8%; hight: 32%; float: top; padding-left: 1%; font-size: 80% } .panel3-nobel2-auto { color: black; width: NA%; hight: 33%; float: top; padding-left: 1%; font-size: 80% } </style> --- count: false ## Many panels: Distribution of Nobel prize winners .panel1-nobel3-auto[ ```r # filter obs from top 5 countries; create date column *nobel ``` ] .panel2-nobel3-auto[ ``` # A tibble: 881 × 7 prize_year category laureate_id full_name gender organization_country <dbl> <chr> <dbl> <chr> <chr> <chr> 1 1901 Physics 1 Wilhelm Conrad… Male Germany 2 1901 Chemistry 160 Jacobus Henric… Male Germany 3 1901 Medicine 293 Emil Adolf von… Male Germany 4 1901 Peace 462 Jean Henry Dun… Male <NA> 5 1901 Peace 463 Frédéric Passy Male <NA> 6 1901 Literature 569 Sully Prudhomme Male <NA> 7 1902 Physics 2 Hendrik Antoon… Male Netherlands 8 1902 Physics 3 Pieter Zeeman Male Netherlands 9 1902 Chemistry 161 Hermann Emil F… Male Germany 10 1902 Medicine 294 Ronald Ross Male United Kingdom # ℹ 871 more rows # ℹ 1 more variable: prize_share <chr> ``` ] --- count: false ## Many panels: Distribution of Nobel prize winners .panel1-nobel3-auto[ ```r # filter obs from top 5 countries; create date column nobel %>% * filter(organization_country %in% top5_country) ``` ] .panel2-nobel3-auto[ ``` # A tibble: 553 × 7 prize_year category laureate_id full_name gender organization_country <dbl> <chr> <dbl> <chr> <chr> <chr> 1 1901 Physics 1 Wilhelm Conrad … Male Germany 2 1901 Chemistry 160 Jacobus Henricu… Male Germany 3 1901 Medicine 293 Emil Adolf von … Male Germany 4 1902 Chemistry 161 Hermann Emil Fi… Male Germany 5 1902 Medicine 294 Ronald Ross Male United Kingdom 6 1903 Physics 4 Antoine Henri B… Male France 7 1903 Physics 5 Pierre Curie Male France 8 1904 Physics 8 Lord Rayleigh (… Male United Kingdom 9 1904 Chemistry 163 Sir William Ram… Male United Kingdom 10 1905 Physics 9 Philipp Eduard … Male Germany # ℹ 543 more rows # ℹ 1 more variable: prize_share <chr> ``` ] --- count: false ## Many panels: Distribution of Nobel prize winners .panel1-nobel3-auto[ ```r # filter obs from top 5 countries; create date column nobel %>% filter(organization_country %in% top5_country) %>% * mutate(prize_date = lubridate::ymd(paste0(prize_year, "-12-10"))) ``` ] .panel2-nobel3-auto[ ``` # A tibble: 553 × 8 prize_year category laureate_id full_name gender organization_country <dbl> <chr> <dbl> <chr> <chr> <chr> 1 1901 Physics 1 Wilhelm Conrad … Male Germany 2 1901 Chemistry 160 Jacobus Henricu… Male Germany 3 1901 Medicine 293 Emil Adolf von … Male Germany 4 1902 Chemistry 161 Hermann Emil Fi… Male Germany 5 1902 Medicine 294 Ronald Ross Male United Kingdom 6 1903 Physics 4 Antoine Henri B… Male France 7 1903 Physics 5 Pierre Curie Male France 8 1904 Physics 8 Lord Rayleigh (… Male United Kingdom 9 1904 Chemistry 163 Sir William Ram… Male United Kingdom 10 1905 Physics 9 Philipp Eduard … Male Germany # ℹ 543 more rows # ℹ 2 more variables: prize_share <chr>, prize_date <date> ``` ] --- count: false ## Many panels: Distribution of Nobel prize winners .panel1-nobel3-auto[ ```r # filter obs from top 5 countries; create date column nobel %>% filter(organization_country %in% top5_country) %>% mutate(prize_date = lubridate::ymd(paste0(prize_year, "-12-10"))) %>% * select(prize_year, prize_date, everything()) ``` ] .panel2-nobel3-auto[ ``` # A tibble: 553 × 8 prize_year prize_date category laureate_id full_name gender <dbl> <date> <chr> <dbl> <chr> <chr> 1 1901 1901-12-10 Physics 1 Wilhelm Conrad Röntgen Male 2 1901 1901-12-10 Chemistry 160 Jacobus Henricus van 't H… Male 3 1901 1901-12-10 Medicine 293 Emil Adolf von Behring Male 4 1902 1902-12-10 Chemistry 161 Hermann Emil Fischer Male 5 1902 1902-12-10 Medicine 294 Ronald Ross Male 6 1903 1903-12-10 Physics 4 Antoine Henri Becquerel Male 7 1903 1903-12-10 Physics 5 Pierre Curie Male 8 1904 1904-12-10 Physics 8 Lord Rayleigh (John Willi… Male 9 1904 1904-12-10 Chemistry 163 Sir William Ramsay Male 10 1905 1905-12-10 Physics 9 Philipp Eduard Anton von … Male # ℹ 543 more rows # ℹ 2 more variables: organization_country <chr>, prize_share <chr> ``` ] --- count: false ## Many panels: Distribution of Nobel prize winners .panel1-nobel3-auto[ ```r # filter obs from top 5 countries; create date column nobel %>% filter(organization_country %in% top5_country) %>% mutate(prize_date = lubridate::ymd(paste0(prize_year, "-12-10"))) %>% select(prize_year, prize_date, everything()) -> * nobel_top5c ``` ] .panel2-nobel3-auto[ ] <style> .panel1-nobel3-auto { color: black; width: 88.2%; hight: 32%; float: top; padding-left: 1%; font-size: 80% } .panel2-nobel3-auto { color: black; width: 9.8%; hight: 32%; float: top; padding-left: 1%; font-size: 80% } .panel3-nobel3-auto { color: black; width: NA%; hight: 33%; float: top; padding-left: 1%; font-size: 80% } </style> --- count: false ## Distribution of Nobel prize winners w/ facet_grid() .panel1-nobel4-auto[ ```r *ggplot(nobel_top5c, aes(x = prize_date)) ``` ] .panel2-nobel4-auto[ <!-- --> ] --- count: false ## Distribution of Nobel prize winners w/ facet_grid() .panel1-nobel4-auto[ ```r ggplot(nobel_top5c, aes(x = prize_date)) + * theme_cavis_hgrid ``` ] .panel2-nobel4-auto[ <!-- --> ] --- count: false ## Distribution of Nobel prize winners w/ facet_grid() .panel1-nobel4-auto[ ```r ggplot(nobel_top5c, aes(x = prize_date)) + theme_cavis_hgrid + * facet_grid(category ~ organization_country) ``` ] .panel2-nobel4-auto[ <!-- --> ] --- count: false ## Distribution of Nobel prize winners w/ facet_grid() .panel1-nobel4-auto[ ```r ggplot(nobel_top5c, aes(x = prize_date)) + theme_cavis_hgrid + facet_grid(category ~ organization_country) + * geom_histogram() ``` ] .panel2-nobel4-auto[ <!-- --> ] --- count: false ## Distribution of Nobel prize winners w/ facet_grid() .panel1-nobel4-auto[ ```r ggplot(nobel_top5c, aes(x = prize_date)) + theme_cavis_hgrid + facet_grid(category ~ organization_country) + geom_histogram() + * scale_x_date( * date_labels = "%y'", * date_breaks = "25 years" * ) ``` ] .panel2-nobel4-auto[ 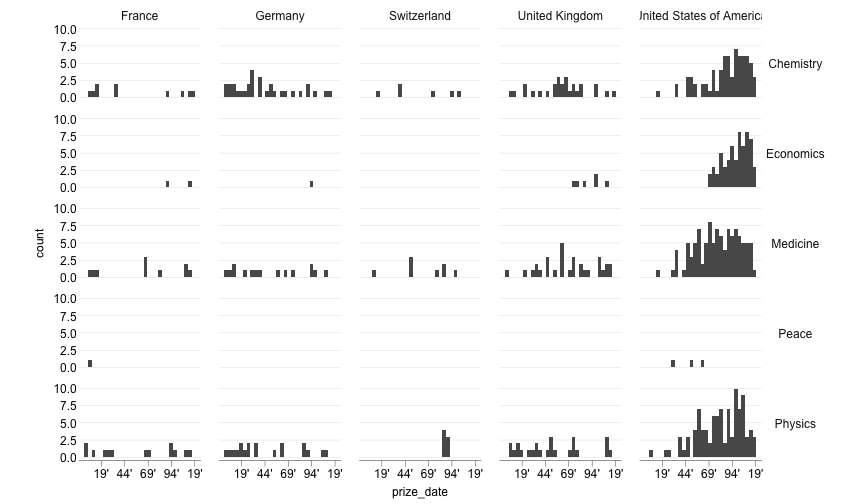<!-- --> ] --- count: false ## Distribution of Nobel prize winners w/ facet_grid() .panel1-nobel4-auto[ ```r ggplot(nobel_top5c, aes(x = prize_date)) + theme_cavis_hgrid + facet_grid(category ~ organization_country) + geom_histogram() + scale_x_date( date_labels = "%y'", date_breaks = "25 years" ) + * scale_y_continuous( * breaks = seq(0, 9, by = 3), * expand = c(0, 0) * ) ``` ] .panel2-nobel4-auto[ 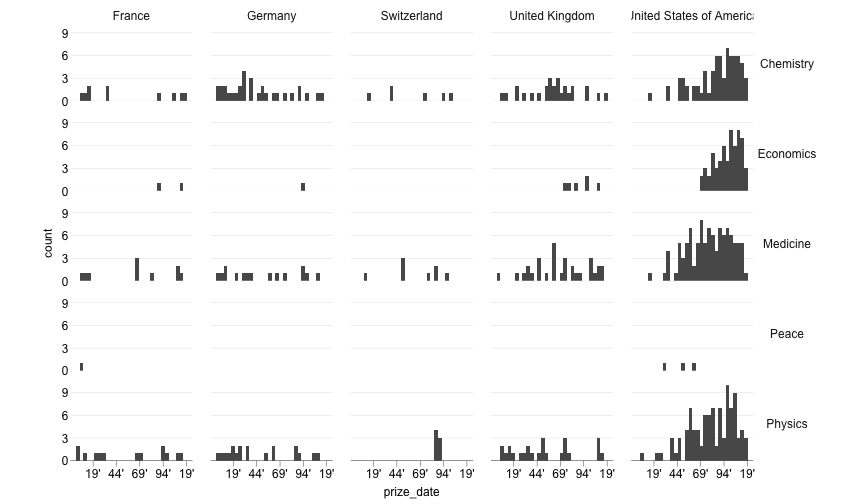<!-- --> ] --- count: false ## Distribution of Nobel prize winners w/ facet_grid() .panel1-nobel4-auto[ ```r ggplot(nobel_top5c, aes(x = prize_date)) + theme_cavis_hgrid + facet_grid(category ~ organization_country) + geom_histogram() + scale_x_date( date_labels = "%y'", date_breaks = "25 years" ) + scale_y_continuous( breaks = seq(0, 9, by = 3), expand = c(0, 0) ) + * labs(y = "Count", x = "Year of award") ``` ] .panel2-nobel4-auto[ 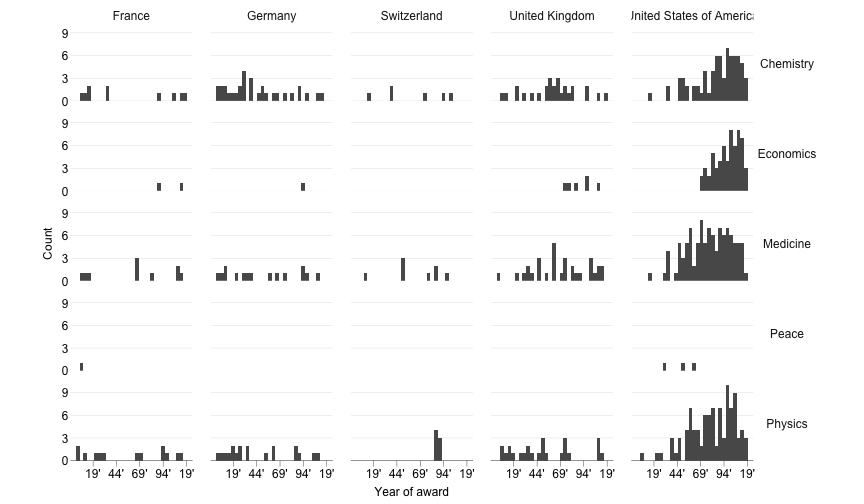<!-- --> ] <style> .panel1-nobel4-auto { color: black; width: 49%; hight: 32%; float: left; padding-left: 1%; font-size: 80% } .panel2-nobel4-auto { color: black; width: 49%; hight: 32%; float: left; padding-left: 1%; font-size: 80% } .panel3-nobel4-auto { color: black; width: NA%; hight: 33%; float: left; padding-left: 1%; font-size: 80% } </style> --- count: false ## Distribution of Nobel prize winners w/ facet_wrap() .panel1-nobel4-rotate[ ```r ggplot(nobel_top5c, aes(x = prize_date)) + theme_cavis_hgrid + * facet_wrap(category ~ organization_country) + geom_histogram() + scale_x_date( date_labels = "%y'", date_breaks = "25 years" ) + scale_y_continuous( breaks = seq(0, 9, by = 3), expand = c(0, 0) ) + labs(y = "Count", x = "Year of award") ``` ] .panel2-nobel4-rotate[ 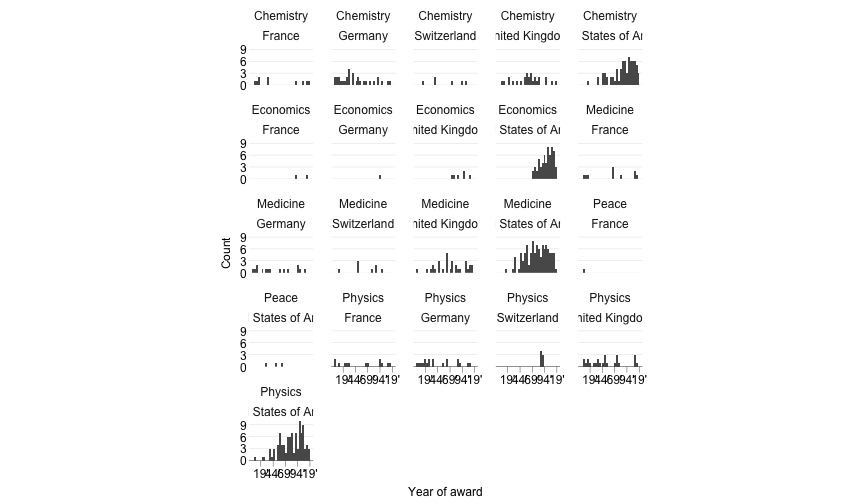<!-- --> ] --- count: false ## Distribution of Nobel prize winners w/ facet_wrap() .panel1-nobel4-rotate[ ```r ggplot(nobel_top5c, aes(x = prize_date)) + theme_cavis_hgrid + * facet_wrap(category ~ organization_country, nrow = 3) + geom_histogram() + scale_x_date( date_labels = "%y'", date_breaks = "25 years" ) + scale_y_continuous( breaks = seq(0, 9, by = 3), expand = c(0, 0) ) + labs(y = "Count", x = "Year of award") ``` ] .panel2-nobel4-rotate[ <!-- --> ] <style> .panel1-nobel4-rotate { color: black; width: 49%; hight: 32%; float: left; padding-left: 1%; font-size: 80% } .panel2-nobel4-rotate { color: black; width: 49%; hight: 32%; float: left; padding-left: 1%; font-size: 80% } .panel3-nobel4-rotate { color: black; width: NA%; hight: 33%; float: left; padding-left: 1%; font-size: 80% } </style> --- ## Distribution of Nobel prize winners w/ facet_wrap() - But do you really need that many panels? -- - Problems of data sparsity and not easy comparison -- --- count: false ## Distribution of Nobel prize winners w/ facet_wrap() .panel1-nobel5a-auto[ ```r *nobel_top5c ``` ] .panel2-nobel5a-auto[ ``` # A tibble: 553 × 8 prize_year prize_date category laureate_id full_name gender <dbl> <date> <chr> <dbl> <chr> <chr> 1 1901 1901-12-10 Physics 1 Wilhelm Conrad Röntgen Male 2 1901 1901-12-10 Chemistry 160 Jacobus Henricus van 't H… Male 3 1901 1901-12-10 Medicine 293 Emil Adolf von Behring Male 4 1902 1902-12-10 Chemistry 161 Hermann Emil Fischer Male 5 1902 1902-12-10 Medicine 294 Ronald Ross Male 6 1903 1903-12-10 Physics 4 Antoine Henri Becquerel Male 7 1903 1903-12-10 Physics 5 Pierre Curie Male 8 1904 1904-12-10 Physics 8 Lord Rayleigh (John Willi… Male 9 1904 1904-12-10 Chemistry 163 Sir William Ramsay Male 10 1905 1905-12-10 Physics 9 Philipp Eduard Anton von … Male # ℹ 543 more rows # ℹ 2 more variables: organization_country <chr>, prize_share <chr> ``` ] --- count: false ## Distribution of Nobel prize winners w/ facet_wrap() .panel1-nobel5a-auto[ ```r nobel_top5c %>% * mutate(decade = prize_year %/% 10 * 10) ``` ] .panel2-nobel5a-auto[ ``` # A tibble: 553 × 9 prize_year prize_date category laureate_id full_name gender <dbl> <date> <chr> <dbl> <chr> <chr> 1 1901 1901-12-10 Physics 1 Wilhelm Conrad Röntgen Male 2 1901 1901-12-10 Chemistry 160 Jacobus Henricus van 't H… Male 3 1901 1901-12-10 Medicine 293 Emil Adolf von Behring Male 4 1902 1902-12-10 Chemistry 161 Hermann Emil Fischer Male 5 1902 1902-12-10 Medicine 294 Ronald Ross Male 6 1903 1903-12-10 Physics 4 Antoine Henri Becquerel Male 7 1903 1903-12-10 Physics 5 Pierre Curie Male 8 1904 1904-12-10 Physics 8 Lord Rayleigh (John Willi… Male 9 1904 1904-12-10 Chemistry 163 Sir William Ramsay Male 10 1905 1905-12-10 Physics 9 Philipp Eduard Anton von … Male # ℹ 543 more rows # ℹ 3 more variables: organization_country <chr>, prize_share <chr>, # decade <dbl> ``` ] --- count: false ## Distribution of Nobel prize winners w/ facet_wrap() .panel1-nobel5a-auto[ ```r nobel_top5c %>% mutate(decade = prize_year %/% 10 * 10) %>% * group_by(decade, category, organization_country) ``` ] .panel2-nobel5a-auto[ ``` # A tibble: 553 × 9 # Groups: decade, category, organization_country [137] prize_year prize_date category laureate_id full_name gender <dbl> <date> <chr> <dbl> <chr> <chr> 1 1901 1901-12-10 Physics 1 Wilhelm Conrad Röntgen Male 2 1901 1901-12-10 Chemistry 160 Jacobus Henricus van 't H… Male 3 1901 1901-12-10 Medicine 293 Emil Adolf von Behring Male 4 1902 1902-12-10 Chemistry 161 Hermann Emil Fischer Male 5 1902 1902-12-10 Medicine 294 Ronald Ross Male 6 1903 1903-12-10 Physics 4 Antoine Henri Becquerel Male 7 1903 1903-12-10 Physics 5 Pierre Curie Male 8 1904 1904-12-10 Physics 8 Lord Rayleigh (John Willi… Male 9 1904 1904-12-10 Chemistry 163 Sir William Ramsay Male 10 1905 1905-12-10 Physics 9 Philipp Eduard Anton von … Male # ℹ 543 more rows # ℹ 3 more variables: organization_country <chr>, prize_share <chr>, # decade <dbl> ``` ] --- count: false ## Distribution of Nobel prize winners w/ facet_wrap() .panel1-nobel5a-auto[ ```r nobel_top5c %>% mutate(decade = prize_year %/% 10 * 10) %>% group_by(decade, category, organization_country) %>% * count() ``` ] .panel2-nobel5a-auto[ ``` # A tibble: 137 × 4 # Groups: decade, category, organization_country [137] decade category organization_country n <dbl> <chr> <chr> <int> 1 1900 Chemistry France 1 2 1900 Chemistry Germany 5 3 1900 Chemistry United Kingdom 2 4 1900 Medicine France 2 5 1900 Medicine Germany 3 6 1900 Medicine Switzerland 1 7 1900 Medicine United Kingdom 1 8 1900 Peace France 1 9 1900 Physics France 3 10 1900 Physics Germany 2 # ℹ 127 more rows ``` ] --- count: false ## Distribution of Nobel prize winners w/ facet_wrap() .panel1-nobel5a-auto[ ```r nobel_top5c %>% mutate(decade = prize_year %/% 10 * 10) %>% group_by(decade, category, organization_country) %>% count() %>% * filter(category != "Peace") ``` ] .panel2-nobel5a-auto[ ``` # A tibble: 133 × 4 # Groups: decade, category, organization_country [133] decade category organization_country n <dbl> <chr> <chr> <int> 1 1900 Chemistry France 1 2 1900 Chemistry Germany 5 3 1900 Chemistry United Kingdom 2 4 1900 Medicine France 2 5 1900 Medicine Germany 3 6 1900 Medicine Switzerland 1 7 1900 Medicine United Kingdom 1 8 1900 Physics France 3 9 1900 Physics Germany 2 10 1900 Physics United Kingdom 3 # ℹ 123 more rows ``` ] --- count: false ## Distribution of Nobel prize winners w/ facet_wrap() .panel1-nobel5a-auto[ ```r nobel_top5c %>% mutate(decade = prize_year %/% 10 * 10) %>% group_by(decade, category, organization_country) %>% count() %>% filter(category != "Peace") -> * nobel_top5c_count ``` ] .panel2-nobel5a-auto[ ] <style> .panel1-nobel5a-auto { color: black; width: 88.2%; hight: 32%; float: top; padding-left: 1%; font-size: 80% } .panel2-nobel5a-auto { color: black; width: 9.8%; hight: 32%; float: top; padding-left: 1%; font-size: 80% } .panel3-nobel5a-auto { color: black; width: NA%; hight: 33%; float: top; padding-left: 1%; font-size: 80% } </style> --- count: false ## Distribution of Nobel prize winners w/ facet_wrap() .panel1-nobel5b-non_seq[ ```r ggplot(nobel_top5c_count, aes(x = decade, y = n, color = organization_country)) + theme_cavis_hgrid + facet_wrap(~ category) ``` ] .panel2-nobel5b-non_seq[ <!-- --> ] --- count: false ## Distribution of Nobel prize winners w/ facet_wrap() .panel1-nobel5b-non_seq[ ```r ggplot(nobel_top5c_count, aes(x = decade, y = n, color = organization_country)) + theme_cavis_hgrid + facet_wrap(~ category) + * geom_line() ``` ] .panel2-nobel5b-non_seq[ <!-- --> ] --- count: false ## Distribution of Nobel prize winners w/ facet_wrap() .panel1-nobel5b-non_seq[ ```r ggplot(nobel_top5c_count, aes(x = decade, y = n, color = organization_country)) + theme_cavis_hgrid + facet_wrap(~ category) + geom_line() + * scale_color_brewer(type = "qual", palette = 3) ``` ] .panel2-nobel5b-non_seq[ <!-- --> ] --- count: false ## Distribution of Nobel prize winners w/ facet_wrap() .panel1-nobel5b-non_seq[ ```r ggplot(nobel_top5c_count, aes(x = decade, y = n, color = organization_country)) + theme_cavis_hgrid + facet_wrap(~ category) + geom_line() + scale_color_brewer(type = "qual", palette = 3) + * theme(legend.position = "top") ``` ] .panel2-nobel5b-non_seq[ <!-- --> ] --- count: false ## Distribution of Nobel prize winners w/ facet_wrap() .panel1-nobel5b-non_seq[ ```r ggplot(nobel_top5c_count, aes(x = decade, y = n, color = organization_country)) + theme_cavis_hgrid + facet_wrap(~ category) + geom_line() + scale_color_brewer(type = "qual", palette = 3) + theme(legend.position = "top") + * geom_point(size = 2) ``` ] .panel2-nobel5b-non_seq[ <!-- --> ] --- count: false ## Distribution of Nobel prize winners w/ facet_wrap() .panel1-nobel5b-non_seq[ ```r ggplot(nobel_top5c_count, aes(x = decade, y = n, color = organization_country)) + theme_cavis_hgrid + facet_wrap(~ category) + geom_line() + scale_color_brewer(type = "qual", palette = 3) + theme(legend.position = "top") + * geom_point(color = "white", size = 4) + geom_point(size = 2) ``` ] .panel2-nobel5b-non_seq[ <!-- --> ] --- count: false ## Distribution of Nobel prize winners w/ facet_wrap() .panel1-nobel5b-non_seq[ ```r ggplot(nobel_top5c_count, aes(x = decade, y = n, color = organization_country)) + theme_cavis_hgrid + facet_wrap(~ category) + geom_line() + scale_color_brewer(type = "qual", palette = 3) + theme(legend.position = "top") + geom_point(color = "white", size = 4) + geom_point(size = 2) + * guides(colour = guide_legend(reverse = TRUE)) ``` ] .panel2-nobel5b-non_seq[ <!-- --> ] --- count: false ## Distribution of Nobel prize winners w/ facet_wrap() .panel1-nobel5b-non_seq[ ```r ggplot(nobel_top5c_count, aes(x = decade, y = n, color = organization_country)) + theme_cavis_hgrid + facet_wrap(~ category) + * geom_vline(xintercept = 1950, linetype = 2, color = "grey45") + geom_line() + scale_color_brewer(type = "qual", palette = 3) + theme(legend.position = "top") + geom_point(color = "white", size = 4) + geom_point(size = 2) + guides(colour = guide_legend(reverse = TRUE)) ``` ] .panel2-nobel5b-non_seq[ <!-- --> ] --- count: false ## Distribution of Nobel prize winners w/ facet_wrap() .panel1-nobel5b-non_seq[ ```r ggplot(nobel_top5c_count, aes(x = decade, y = n, color = organization_country)) + theme_cavis_hgrid + facet_wrap(~ category) + geom_vline(xintercept = 1950, linetype = 2, color = "grey45") + geom_line() + scale_color_brewer(type = "qual", palette = 3) + theme(legend.position = "top") + geom_point(color = "white", size = 4) + geom_point(size = 2) + guides(colour = guide_legend(reverse = TRUE)) + * labs(x = "Decade", y = "Total number of awards (per decade)") ``` ] .panel2-nobel5b-non_seq[ <!-- --> ] <style> .panel1-nobel5b-non_seq { color: black; width: 49%; hight: 32%; float: left; padding-left: 1%; font-size: 80% } .panel2-nobel5b-non_seq { color: black; width: 49%; hight: 32%; float: left; padding-left: 1%; font-size: 80% } .panel3-nobel5b-non_seq { color: black; width: NA%; hight: 33%; float: left; padding-left: 1%; font-size: 80% } </style> --- count: false ## Many panels: Time trend of shares of Nobel prize .panel1-nobel6-auto[ ```r # some wrangling *nobel ``` ] .panel2-nobel6-auto[ ``` # A tibble: 881 × 7 prize_year category laureate_id full_name gender organization_country <dbl> <chr> <dbl> <chr> <chr> <chr> 1 1901 Physics 1 Wilhelm Conrad… Male Germany 2 1901 Chemistry 160 Jacobus Henric… Male Germany 3 1901 Medicine 293 Emil Adolf von… Male Germany 4 1901 Peace 462 Jean Henry Dun… Male <NA> 5 1901 Peace 463 Frédéric Passy Male <NA> 6 1901 Literature 569 Sully Prudhomme Male <NA> 7 1902 Physics 2 Hendrik Antoon… Male Netherlands 8 1902 Physics 3 Pieter Zeeman Male Netherlands 9 1902 Chemistry 161 Hermann Emil F… Male Germany 10 1902 Medicine 294 Ronald Ross Male United Kingdom # ℹ 871 more rows # ℹ 1 more variable: prize_share <chr> ``` ] --- count: false ## Many panels: Time trend of shares of Nobel prize .panel1-nobel6-auto[ ```r # some wrangling nobel %>% * mutate(prize_share2 = case_when(prize_share == "1/1" ~ 1, * prize_share == "1/2" ~ 1/2, * prize_share == "1/3" ~ 1/3, * prize_share == "1/4" ~ 1/4)) ``` ] .panel2-nobel6-auto[ ``` # A tibble: 881 × 8 prize_year category laureate_id full_name gender organization_country <dbl> <chr> <dbl> <chr> <chr> <chr> 1 1901 Physics 1 Wilhelm Conrad… Male Germany 2 1901 Chemistry 160 Jacobus Henric… Male Germany 3 1901 Medicine 293 Emil Adolf von… Male Germany 4 1901 Peace 462 Jean Henry Dun… Male <NA> 5 1901 Peace 463 Frédéric Passy Male <NA> 6 1901 Literature 569 Sully Prudhomme Male <NA> 7 1902 Physics 2 Hendrik Antoon… Male Netherlands 8 1902 Physics 3 Pieter Zeeman Male Netherlands 9 1902 Chemistry 161 Hermann Emil F… Male Germany 10 1902 Medicine 294 Ronald Ross Male United Kingdom # ℹ 871 more rows # ℹ 2 more variables: prize_share <chr>, prize_share2 <dbl> ``` ] --- count: false ## Many panels: Time trend of shares of Nobel prize .panel1-nobel6-auto[ ```r # some wrangling nobel %>% mutate(prize_share2 = case_when(prize_share == "1/1" ~ 1, prize_share == "1/2" ~ 1/2, prize_share == "1/3" ~ 1/3, prize_share == "1/4" ~ 1/4)) %>% * mutate(last_name = str_extract(full_name, "(?<=[ -])\\w+$")) ``` ] .panel2-nobel6-auto[ ``` # A tibble: 881 × 9 prize_year category laureate_id full_name gender organization_country <dbl> <chr> <dbl> <chr> <chr> <chr> 1 1901 Physics 1 Wilhelm Conrad… Male Germany 2 1901 Chemistry 160 Jacobus Henric… Male Germany 3 1901 Medicine 293 Emil Adolf von… Male Germany 4 1901 Peace 462 Jean Henry Dun… Male <NA> 5 1901 Peace 463 Frédéric Passy Male <NA> 6 1901 Literature 569 Sully Prudhomme Male <NA> 7 1902 Physics 2 Hendrik Antoon… Male Netherlands 8 1902 Physics 3 Pieter Zeeman Male Netherlands 9 1902 Chemistry 161 Hermann Emil F… Male Germany 10 1902 Medicine 294 Ronald Ross Male United Kingdom # ℹ 871 more rows # ℹ 3 more variables: prize_share <chr>, prize_share2 <dbl>, last_name <chr> ``` ] --- count: false ## Many panels: Time trend of shares of Nobel prize .panel1-nobel6-auto[ ```r # some wrangling nobel %>% mutate(prize_share2 = case_when(prize_share == "1/1" ~ 1, prize_share == "1/2" ~ 1/2, prize_share == "1/3" ~ 1/3, prize_share == "1/4" ~ 1/4)) %>% mutate(last_name = str_extract(full_name, "(?<=[ -])\\w+$")) -> * nobel2 ``` ] .panel2-nobel6-auto[ ] --- count: false ## Many panels: Time trend of shares of Nobel prize .panel1-nobel6-auto[ ```r # some wrangling nobel %>% mutate(prize_share2 = case_when(prize_share == "1/1" ~ 1, prize_share == "1/2" ~ 1/2, prize_share == "1/3" ~ 1/3, prize_share == "1/4" ~ 1/4)) %>% mutate(last_name = str_extract(full_name, "(?<=[ -])\\w+$")) -> nobel2 # get colors *colors <- brewer.pal(n = 5, name = "Set1") ``` ] .panel2-nobel6-auto[ ] --- count: false ## Many panels: Time trend of shares of Nobel prize .panel1-nobel6-auto[ ```r # some wrangling nobel %>% mutate(prize_share2 = case_when(prize_share == "1/1" ~ 1, prize_share == "1/2" ~ 1/2, prize_share == "1/3" ~ 1/3, prize_share == "1/4" ~ 1/4)) %>% mutate(last_name = str_extract(full_name, "(?<=[ -])\\w+$")) -> nobel2 # get colors colors <- brewer.pal(n = 5, name = "Set1") *blue <- colors[2] ``` ] .panel2-nobel6-auto[ ] --- count: false ## Many panels: Time trend of shares of Nobel prize .panel1-nobel6-auto[ ```r # some wrangling nobel %>% mutate(prize_share2 = case_when(prize_share == "1/1" ~ 1, prize_share == "1/2" ~ 1/2, prize_share == "1/3" ~ 1/3, prize_share == "1/4" ~ 1/4)) %>% mutate(last_name = str_extract(full_name, "(?<=[ -])\\w+$")) -> nobel2 # get colors colors <- brewer.pal(n = 5, name = "Set1") blue <- colors[2] *orange <- colors[5] ``` ] .panel2-nobel6-auto[ ] <style> .panel1-nobel6-auto { color: black; width: 88.2%; hight: 32%; float: top; padding-left: 1%; font-size: 80% } .panel2-nobel6-auto { color: black; width: 9.8%; hight: 32%; float: top; padding-left: 1%; font-size: 80% } .panel3-nobel6-auto { color: black; width: NA%; hight: 33%; float: top; padding-left: 1%; font-size: 80% } </style> --- count: false ## Many panels: Time trend of shares of Nobel prize .panel1-nobel7-auto[ ```r *nobel2 ``` ] .panel2-nobel7-auto[ ``` # A tibble: 881 × 9 prize_year category laureate_id full_name gender organization_country <dbl> <chr> <dbl> <chr> <chr> <chr> 1 1901 Physics 1 Wilhelm Conrad… Male Germany 2 1901 Chemistry 160 Jacobus Henric… Male Germany 3 1901 Medicine 293 Emil Adolf von… Male Germany 4 1901 Peace 462 Jean Henry Dun… Male <NA> 5 1901 Peace 463 Frédéric Passy Male <NA> 6 1901 Literature 569 Sully Prudhomme Male <NA> 7 1902 Physics 2 Hendrik Antoon… Male Netherlands 8 1902 Physics 3 Pieter Zeeman Male Netherlands 9 1902 Chemistry 161 Hermann Emil F… Male Germany 10 1902 Medicine 294 Ronald Ross Male United Kingdom # ℹ 871 more rows # ℹ 3 more variables: prize_share <chr>, prize_share2 <dbl>, last_name <chr> ``` ] --- count: false ## Many panels: Time trend of shares of Nobel prize .panel1-nobel7-auto[ ```r nobel2 %>% * ggplot(aes(x = prize_year, y = prize_share2)) ``` ] .panel2-nobel7-auto[ <!-- --> ] --- count: false ## Many panels: Time trend of shares of Nobel prize .panel1-nobel7-auto[ ```r nobel2 %>% ggplot(aes(x = prize_year, y = prize_share2)) + * theme_cavis_hgrid ``` ] .panel2-nobel7-auto[ <!-- --> ] --- count: false ## Many panels: Time trend of shares of Nobel prize .panel1-nobel7-auto[ ```r nobel2 %>% ggplot(aes(x = prize_year, y = prize_share2)) + theme_cavis_hgrid + * facet_wrap(~ category) ``` ] .panel2-nobel7-auto[ <!-- --> ] --- count: false ## Many panels: Time trend of shares of Nobel prize .panel1-nobel7-auto[ ```r nobel2 %>% ggplot(aes(x = prize_year, y = prize_share2)) + theme_cavis_hgrid + facet_wrap(~ category) + * geom_point(aes(color = gender, shape = gender)) ``` ] .panel2-nobel7-auto[ <!-- --> ] --- count: false ## Many panels: Time trend of shares of Nobel prize .panel1-nobel7-auto[ ```r nobel2 %>% ggplot(aes(x = prize_year, y = prize_share2)) + theme_cavis_hgrid + facet_wrap(~ category) + geom_point(aes(color = gender, shape = gender)) + * scale_color_manual(values = c(orange, blue)) ``` ] .panel2-nobel7-auto[ <!-- --> ] --- count: false ## Many panels: Time trend of shares of Nobel prize .panel1-nobel7-auto[ ```r nobel2 %>% ggplot(aes(x = prize_year, y = prize_share2)) + theme_cavis_hgrid + facet_wrap(~ category) + geom_point(aes(color = gender, shape = gender)) + scale_color_manual(values = c(orange, blue)) + * scale_shape_manual(values = c(8, 1)) ``` ] .panel2-nobel7-auto[ <!-- --> ] --- count: false ## Many panels: Time trend of shares of Nobel prize .panel1-nobel7-auto[ ```r nobel2 %>% ggplot(aes(x = prize_year, y = prize_share2)) + theme_cavis_hgrid + facet_wrap(~ category) + geom_point(aes(color = gender, shape = gender)) + scale_color_manual(values = c(orange, blue)) + scale_shape_manual(values = c(8, 1)) + * geom_smooth(method = "gam", color = "grey45", * alpha = 0.25, size = 0.5) ``` ] .panel2-nobel7-auto[ <!-- --> ] --- count: false ## Many panels: Time trend of shares of Nobel prize .panel1-nobel7-auto[ ```r nobel2 %>% ggplot(aes(x = prize_year, y = prize_share2)) + theme_cavis_hgrid + facet_wrap(~ category) + geom_point(aes(color = gender, shape = gender)) + scale_color_manual(values = c(orange, blue)) + scale_shape_manual(values = c(8, 1)) + geom_smooth(method = "gam", color = "grey45", alpha = 0.25, size = 0.5) + * scale_y_continuous(breaks = c(1/4, 1/3, 1/2, 1), * labels = c("1/4", "1/3", "1/2", "1")) ``` ] .panel2-nobel7-auto[ <!-- --> ] --- count: false ## Many panels: Time trend of shares of Nobel prize .panel1-nobel7-auto[ ```r nobel2 %>% ggplot(aes(x = prize_year, y = prize_share2)) + theme_cavis_hgrid + facet_wrap(~ category) + geom_point(aes(color = gender, shape = gender)) + scale_color_manual(values = c(orange, blue)) + scale_shape_manual(values = c(8, 1)) + geom_smooth(method = "gam", color = "grey45", alpha = 0.25, size = 0.5) + scale_y_continuous(breaks = c(1/4, 1/3, 1/2, 1), labels = c("1/4", "1/3", "1/2", "1")) + * theme(legend.position = "top") ``` ] .panel2-nobel7-auto[ <!-- --> ] --- count: false ## Many panels: Time trend of shares of Nobel prize .panel1-nobel7-auto[ ```r nobel2 %>% ggplot(aes(x = prize_year, y = prize_share2)) + theme_cavis_hgrid + facet_wrap(~ category) + geom_point(aes(color = gender, shape = gender)) + scale_color_manual(values = c(orange, blue)) + scale_shape_manual(values = c(8, 1)) + geom_smooth(method = "gam", color = "grey45", alpha = 0.25, size = 0.5) + scale_y_continuous(breaks = c(1/4, 1/3, 1/2, 1), labels = c("1/4", "1/3", "1/2", "1")) + theme(legend.position = "top") + * labs(y = "Avg prize share", x = "Year of award") ``` ] .panel2-nobel7-auto[ <!-- --> ] --- count: false ## Many panels: Time trend of shares of Nobel prize .panel1-nobel7-auto[ ```r nobel2 %>% ggplot(aes(x = prize_year, y = prize_share2)) + theme_cavis_hgrid + facet_wrap(~ category) + geom_point(aes(color = gender, shape = gender)) + scale_color_manual(values = c(orange, blue)) + scale_shape_manual(values = c(8, 1)) + geom_smooth(method = "gam", color = "grey45", alpha = 0.25, size = 0.5) + scale_y_continuous(breaks = c(1/4, 1/3, 1/2, 1), labels = c("1/4", "1/3", "1/2", "1")) + theme(legend.position = "top") + labs(y = "Avg prize share", x = "Year of award") + * geom_text_repel( * data = filter(nobel2, gender == "Female"), * aes(label = last_name), * color = orange, size = 2.5 * ) ``` ] .panel2-nobel7-auto[ 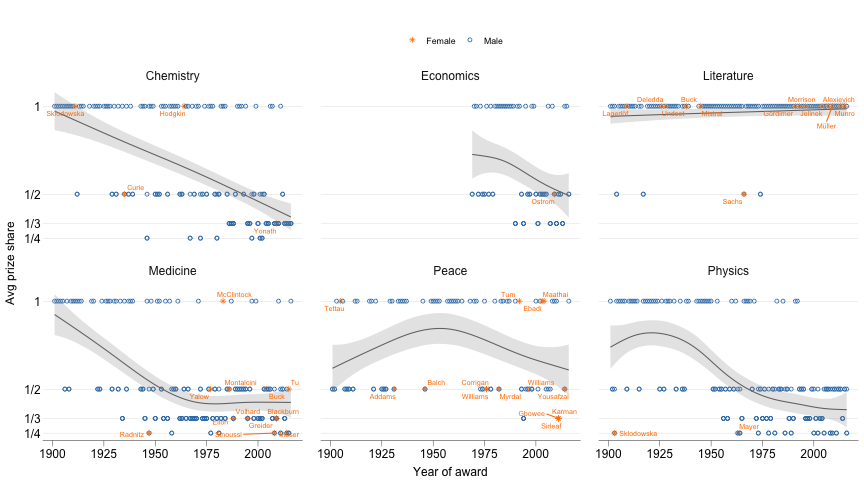<!-- --> ] <style> .panel1-nobel7-auto { color: black; width: 49%; hight: 32%; float: left; padding-left: 1%; font-size: 80% } .panel2-nobel7-auto { color: black; width: 49%; hight: 32%; float: left; padding-left: 1%; font-size: 80% } .panel3-nobel7-auto { color: black; width: NA%; hight: 33%; float: left; padding-left: 1%; font-size: 80% } </style> --- count: false ## Many panels: Time trend of shares of Nobel prize .panel1-nobel8-auto[ ```r # coerce category in factor w/ customized levels *nobel2 ``` ] .panel2-nobel8-auto[ ``` # A tibble: 881 × 9 prize_year category laureate_id full_name gender organization_country <dbl> <chr> <dbl> <chr> <chr> <chr> 1 1901 Physics 1 Wilhelm Conrad… Male Germany 2 1901 Chemistry 160 Jacobus Henric… Male Germany 3 1901 Medicine 293 Emil Adolf von… Male Germany 4 1901 Peace 462 Jean Henry Dun… Male <NA> 5 1901 Peace 463 Frédéric Passy Male <NA> 6 1901 Literature 569 Sully Prudhomme Male <NA> 7 1902 Physics 2 Hendrik Antoon… Male Netherlands 8 1902 Physics 3 Pieter Zeeman Male Netherlands 9 1902 Chemistry 161 Hermann Emil F… Male Germany 10 1902 Medicine 294 Ronald Ross Male United Kingdom # ℹ 871 more rows # ℹ 3 more variables: prize_share <chr>, prize_share2 <dbl>, last_name <chr> ``` ] --- count: false ## Many panels: Time trend of shares of Nobel prize .panel1-nobel8-auto[ ```r # coerce category in factor w/ customized levels nobel2 %>% * mutate(category = factor(category, * levels = c("Chemistry", "Medicine", "Physics", "Economics", "Peace", "Literature"))) ``` ] .panel2-nobel8-auto[ ``` # A tibble: 881 × 9 prize_year category laureate_id full_name gender organization_country <dbl> <fct> <dbl> <chr> <chr> <chr> 1 1901 Physics 1 Wilhelm Conrad… Male Germany 2 1901 Chemistry 160 Jacobus Henric… Male Germany 3 1901 Medicine 293 Emil Adolf von… Male Germany 4 1901 Peace 462 Jean Henry Dun… Male <NA> 5 1901 Peace 463 Frédéric Passy Male <NA> 6 1901 Literature 569 Sully Prudhomme Male <NA> 7 1902 Physics 2 Hendrik Antoon… Male Netherlands 8 1902 Physics 3 Pieter Zeeman Male Netherlands 9 1902 Chemistry 161 Hermann Emil F… Male Germany 10 1902 Medicine 294 Ronald Ross Male United Kingdom # ℹ 871 more rows # ℹ 3 more variables: prize_share <chr>, prize_share2 <dbl>, last_name <chr> ``` ] --- count: false ## Many panels: Time trend of shares of Nobel prize .panel1-nobel8-auto[ ```r # coerce category in factor w/ customized levels nobel2 %>% mutate(category = factor(category, levels = c("Chemistry", "Medicine", "Physics", "Economics", "Peace", "Literature"))) -> * nobel2 ``` ] .panel2-nobel8-auto[ ] --- count: false ## Many panels: Time trend of shares of Nobel prize .panel1-nobel8-auto[ ```r # coerce category in factor w/ customized levels nobel2 %>% mutate(category = factor(category, levels = c("Chemistry", "Medicine", "Physics", "Economics", "Peace", "Literature"))) -> nobel2 # check level *head(nobel2$category) ``` ] .panel2-nobel8-auto[ ``` [1] Physics Chemistry Medicine Peace Peace Literature Levels: Chemistry Medicine Physics Economics Peace Literature ``` ] <style> .panel1-nobel8-auto { color: black; width: 88.2%; hight: 32%; float: top; padding-left: 1%; font-size: 80% } .panel2-nobel8-auto { color: black; width: 9.8%; hight: 32%; float: top; padding-left: 1%; font-size: 80% } .panel3-nobel8-auto { color: black; width: NA%; hight: 33%; float: top; padding-left: 1%; font-size: 80% } </style> --- count: false ## Many panels: Time trend of shares of Nobel prize .panel1-nobel9-auto[ ```r *nobel2 # `category` coerced to factor ``` ] .panel2-nobel9-auto[ ``` # A tibble: 881 × 9 prize_year category laureate_id full_name gender organization_country <dbl> <fct> <dbl> <chr> <chr> <chr> 1 1901 Physics 1 Wilhelm Conrad… Male Germany 2 1901 Chemistry 160 Jacobus Henric… Male Germany 3 1901 Medicine 293 Emil Adolf von… Male Germany 4 1901 Peace 462 Jean Henry Dun… Male <NA> 5 1901 Peace 463 Frédéric Passy Male <NA> 6 1901 Literature 569 Sully Prudhomme Male <NA> 7 1902 Physics 2 Hendrik Antoon… Male Netherlands 8 1902 Physics 3 Pieter Zeeman Male Netherlands 9 1902 Chemistry 161 Hermann Emil F… Male Germany 10 1902 Medicine 294 Ronald Ross Male United Kingdom # ℹ 871 more rows # ℹ 3 more variables: prize_share <chr>, prize_share2 <dbl>, last_name <chr> ``` ] --- count: false ## Many panels: Time trend of shares of Nobel prize .panel1-nobel9-auto[ ```r nobel2 %>% # `category` coerced to factor * ggplot(aes(x = prize_year, y = prize_share2)) ``` ] .panel2-nobel9-auto[ <!-- --> ] --- count: false ## Many panels: Time trend of shares of Nobel prize .panel1-nobel9-auto[ ```r nobel2 %>% # `category` coerced to factor ggplot(aes(x = prize_year, y = prize_share2)) + * theme_cavis_hgrid ``` ] .panel2-nobel9-auto[ <!-- --> ] --- count: false ## Many panels: Time trend of shares of Nobel prize .panel1-nobel9-auto[ ```r nobel2 %>% # `category` coerced to factor ggplot(aes(x = prize_year, y = prize_share2)) + theme_cavis_hgrid + * facet_wrap(~ category) ``` ] .panel2-nobel9-auto[ <!-- --> ] --- count: false ## Many panels: Time trend of shares of Nobel prize .panel1-nobel9-auto[ ```r nobel2 %>% # `category` coerced to factor ggplot(aes(x = prize_year, y = prize_share2)) + theme_cavis_hgrid + facet_wrap(~ category) + * geom_point(aes(color = gender, shape = gender)) ``` ] .panel2-nobel9-auto[ 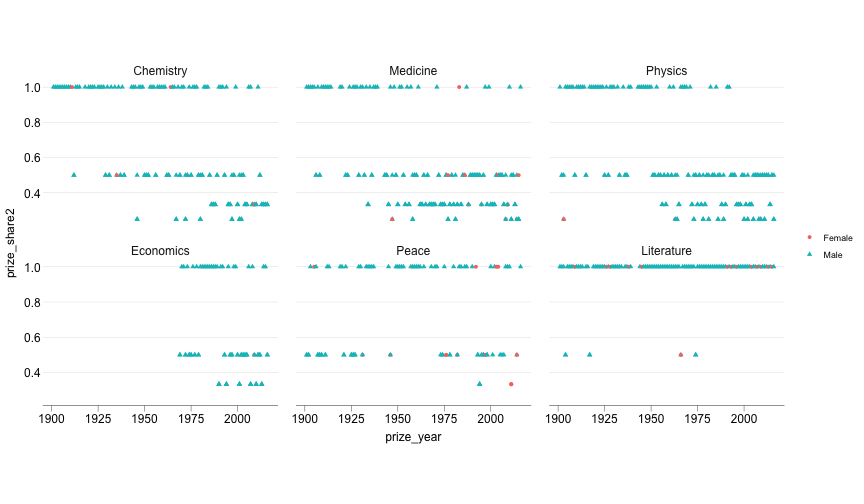<!-- --> ] --- count: false ## Many panels: Time trend of shares of Nobel prize .panel1-nobel9-auto[ ```r nobel2 %>% # `category` coerced to factor ggplot(aes(x = prize_year, y = prize_share2)) + theme_cavis_hgrid + facet_wrap(~ category) + geom_point(aes(color = gender, shape = gender)) + * scale_color_manual(values = c(orange, blue)) ``` ] .panel2-nobel9-auto[ 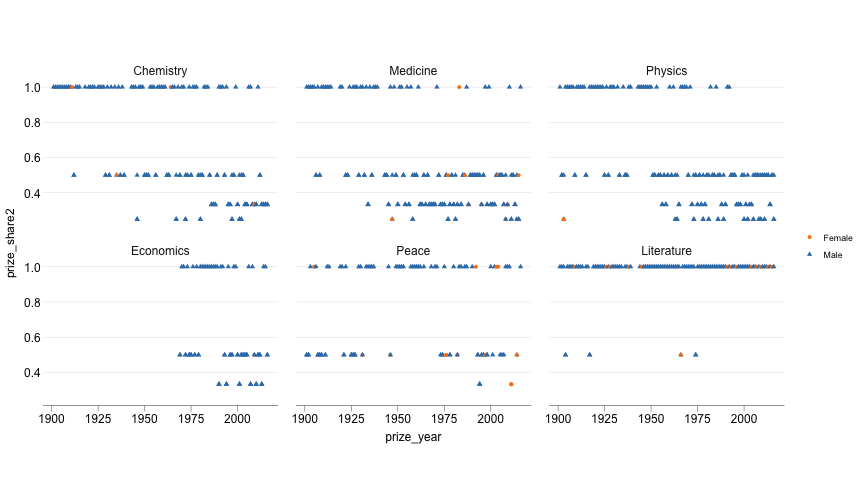<!-- --> ] --- count: false ## Many panels: Time trend of shares of Nobel prize .panel1-nobel9-auto[ ```r nobel2 %>% # `category` coerced to factor ggplot(aes(x = prize_year, y = prize_share2)) + theme_cavis_hgrid + facet_wrap(~ category) + geom_point(aes(color = gender, shape = gender)) + scale_color_manual(values = c(orange, blue)) + * scale_shape_manual(values = c(8, 1)) ``` ] .panel2-nobel9-auto[ 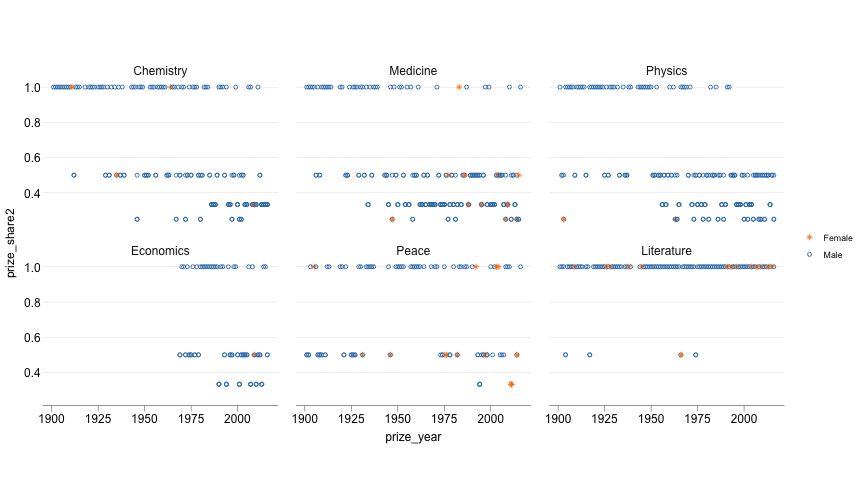<!-- --> ] --- count: false ## Many panels: Time trend of shares of Nobel prize .panel1-nobel9-auto[ ```r nobel2 %>% # `category` coerced to factor ggplot(aes(x = prize_year, y = prize_share2)) + theme_cavis_hgrid + facet_wrap(~ category) + geom_point(aes(color = gender, shape = gender)) + scale_color_manual(values = c(orange, blue)) + scale_shape_manual(values = c(8, 1)) + * geom_smooth(method = "gam", color = "grey45", * alpha = 0.25, size = 0.5) ``` ] .panel2-nobel9-auto[ 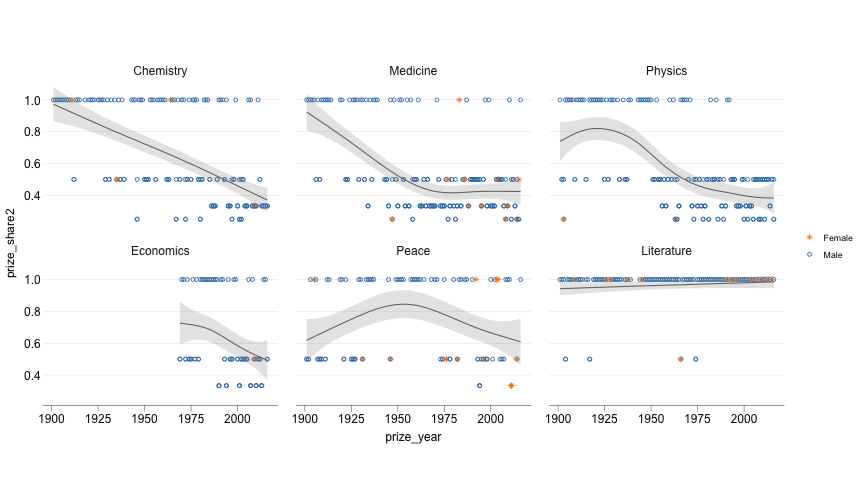<!-- --> ] --- count: false ## Many panels: Time trend of shares of Nobel prize .panel1-nobel9-auto[ ```r nobel2 %>% # `category` coerced to factor ggplot(aes(x = prize_year, y = prize_share2)) + theme_cavis_hgrid + facet_wrap(~ category) + geom_point(aes(color = gender, shape = gender)) + scale_color_manual(values = c(orange, blue)) + scale_shape_manual(values = c(8, 1)) + geom_smooth(method = "gam", color = "grey45", alpha = 0.25, size = 0.5) + * scale_y_continuous(breaks = c(1/4, 1/3, 1/2, 1), * labels = c("1/4", "1/3", "1/2", "1")) ``` ] .panel2-nobel9-auto[ <!-- --> ] --- count: false ## Many panels: Time trend of shares of Nobel prize .panel1-nobel9-auto[ ```r nobel2 %>% # `category` coerced to factor ggplot(aes(x = prize_year, y = prize_share2)) + theme_cavis_hgrid + facet_wrap(~ category) + geom_point(aes(color = gender, shape = gender)) + scale_color_manual(values = c(orange, blue)) + scale_shape_manual(values = c(8, 1)) + geom_smooth(method = "gam", color = "grey45", alpha = 0.25, size = 0.5) + scale_y_continuous(breaks = c(1/4, 1/3, 1/2, 1), labels = c("1/4", "1/3", "1/2", "1")) + * theme(legend.position = "top") ``` ] .panel2-nobel9-auto[ <!-- --> ] --- count: false ## Many panels: Time trend of shares of Nobel prize .panel1-nobel9-auto[ ```r nobel2 %>% # `category` coerced to factor ggplot(aes(x = prize_year, y = prize_share2)) + theme_cavis_hgrid + facet_wrap(~ category) + geom_point(aes(color = gender, shape = gender)) + scale_color_manual(values = c(orange, blue)) + scale_shape_manual(values = c(8, 1)) + geom_smooth(method = "gam", color = "grey45", alpha = 0.25, size = 0.5) + scale_y_continuous(breaks = c(1/4, 1/3, 1/2, 1), labels = c("1/4", "1/3", "1/2", "1")) + theme(legend.position = "top") + * labs(y = "Avg prize share", x = "Year of award") ``` ] .panel2-nobel9-auto[ <!-- --> ] <style> .panel1-nobel9-auto { color: black; width: 49%; hight: 32%; float: left; padding-left: 1%; font-size: 80% } .panel2-nobel9-auto { color: black; width: 49%; hight: 32%; float: left; padding-left: 1%; font-size: 80% } .panel3-nobel9-auto { color: black; width: NA%; hight: 33%; float: left; padding-left: 1%; font-size: 80% } </style> --- count: false ## Many panels: Time trend of shares of Nobel prize .panel1-nobel9-rotate[ ```r nobel2 %>% # `category` coerced to factor ggplot(aes(x = prize_year, y = prize_share2)) + theme_cavis_hgrid + * facet_wrap(~ category, scales = "free_x") + geom_point(aes(color = gender, shape = gender)) + scale_color_manual(values = c(orange, blue)) + scale_shape_manual(values = c(8, 1)) + geom_smooth(method = "gam", color = "grey45", alpha = 0.25, size = 0.5) + scale_y_continuous(breaks = c(1/4, 1/3, 1/2, 1), labels = c("1/4", "1/3", "1/2", "1")) + theme(legend.position = "top") + labs(y = "Avg prize share", x = "Year of award") ``` ] .panel2-nobel9-rotate[ <!-- --> ] --- count: false ## Many panels: Time trend of shares of Nobel prize .panel1-nobel9-rotate[ ```r nobel2 %>% # `category` coerced to factor ggplot(aes(x = prize_year, y = prize_share2)) + theme_cavis_hgrid + * facet_wrap(~ category, scales = "free_y") + geom_point(aes(color = gender, shape = gender)) + scale_color_manual(values = c(orange, blue)) + scale_shape_manual(values = c(8, 1)) + geom_smooth(method = "gam", color = "grey45", alpha = 0.25, size = 0.5) + scale_y_continuous(breaks = c(1/4, 1/3, 1/2, 1), labels = c("1/4", "1/3", "1/2", "1")) + theme(legend.position = "top") + labs(y = "Avg prize share", x = "Year of award") ``` ] .panel2-nobel9-rotate[ 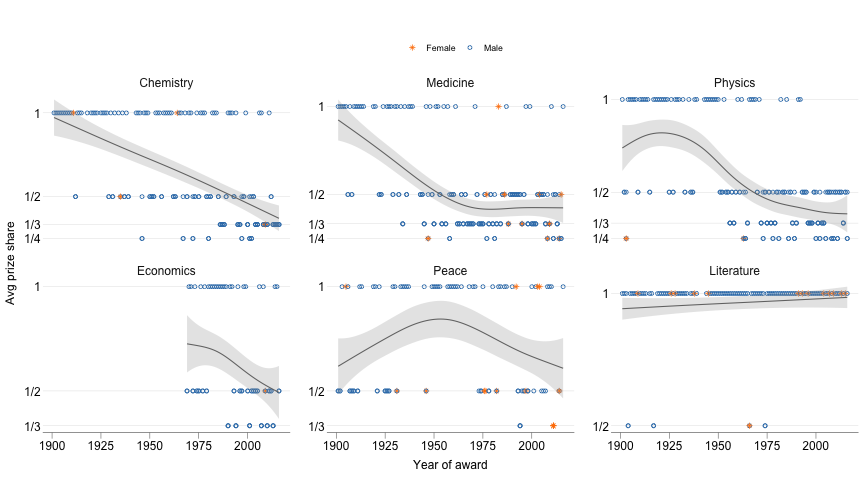<!-- --> ] --- count: false ## Many panels: Time trend of shares of Nobel prize .panel1-nobel9-rotate[ ```r nobel2 %>% # `category` coerced to factor ggplot(aes(x = prize_year, y = prize_share2)) + theme_cavis_hgrid + * facet_wrap(~ category, scales = "free") + geom_point(aes(color = gender, shape = gender)) + scale_color_manual(values = c(orange, blue)) + scale_shape_manual(values = c(8, 1)) + geom_smooth(method = "gam", color = "grey45", alpha = 0.25, size = 0.5) + scale_y_continuous(breaks = c(1/4, 1/3, 1/2, 1), labels = c("1/4", "1/3", "1/2", "1")) + theme(legend.position = "top") + labs(y = "Avg prize share", x = "Year of award") ``` ] .panel2-nobel9-rotate[ 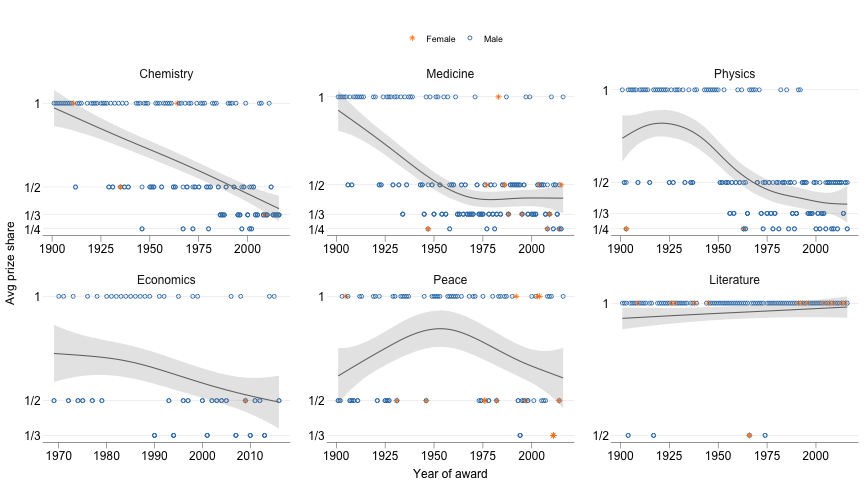<!-- --> ] --- count: false ## Many panels: Time trend of shares of Nobel prize .panel1-nobel9-rotate[ ```r nobel2 %>% # `category` coerced to factor ggplot(aes(x = prize_year, y = prize_share2)) + theme_cavis_hgrid + * facet_wrap(~ category, scales = "free_x") + geom_point(aes(color = gender, shape = gender)) + scale_color_manual(values = c(orange, blue)) + scale_shape_manual(values = c(8, 1)) + geom_smooth(method = "gam", color = "grey45", alpha = 0.25, size = 0.5) + scale_y_continuous(breaks = c(1/4, 1/3, 1/2, 1), labels = c("1/4", "1/3", "1/2", "1")) + theme(legend.position = "top") + labs(y = "Avg prize share", x = "Year of award") ``` ] .panel2-nobel9-rotate[ 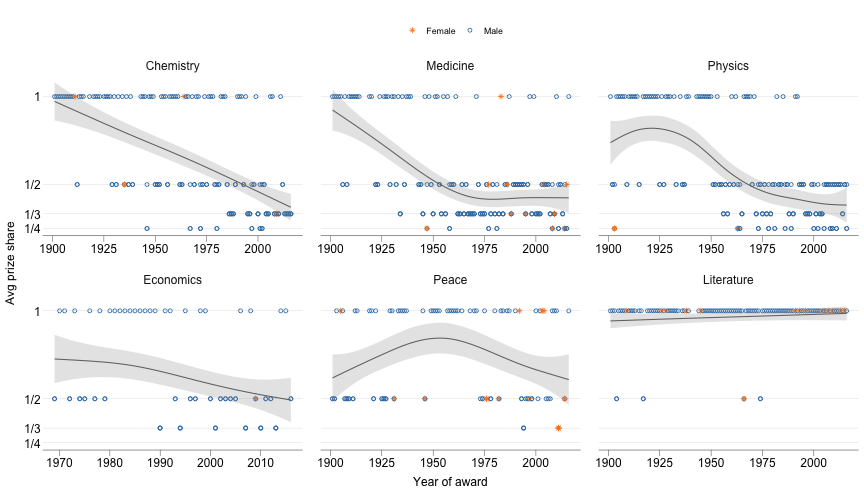<!-- --> ] <style> .panel1-nobel9-rotate { color: black; width: 49%; hight: 32%; float: left; padding-left: 1%; font-size: 80% } .panel2-nobel9-rotate { color: black; width: 49%; hight: 32%; float: left; padding-left: 1%; font-size: 80% } .panel3-nobel9-rotate { color: black; width: NA%; hight: 33%; float: left; padding-left: 1%; font-size: 80% } </style> --- ## Many panels: Measles in the US example - Data: Measles level 1 incidence (cases per 100,000 people) -- - Coverage: 51 US states; 76 years (3,876 observations) -- - Sometimes `facet_wrap()` is not necessarily the only, or the best option --- count: false ## Many panels: Measles in the US example .panel1-measles1-auto[ ```r *measles <- read_csv("data/measles.csv") ``` ] .panel2-measles1-auto[ ] --- count: false ## Many panels: Measles in the US example .panel1-measles1-auto[ ```r measles <- read_csv("data/measles.csv") *ggplot(measles, aes(x = year, y = count)) ``` ] .panel2-measles1-auto[ <!-- --> ] --- count: false ## Many panels: Measles in the US example .panel1-measles1-auto[ ```r measles <- read_csv("data/measles.csv") ggplot(measles, aes(x = year, y = count)) + * theme_cavis_hgrid ``` ] .panel2-measles1-auto[ <!-- --> ] --- count: false ## Many panels: Measles in the US example .panel1-measles1-auto[ ```r measles <- read_csv("data/measles.csv") ggplot(measles, aes(x = year, y = count)) + theme_cavis_hgrid + * facet_wrap(~ state, nrow = 5) ``` ] .panel2-measles1-auto[ <!-- --> ] --- count: false ## Many panels: Measles in the US example .panel1-measles1-auto[ ```r measles <- read_csv("data/measles.csv") ggplot(measles, aes(x = year, y = count)) + theme_cavis_hgrid + facet_wrap(~ state, nrow = 5) + * geom_line() ``` ] .panel2-measles1-auto[ <!-- --> ] <style> .panel1-measles1-auto { color: black; width: 49%; hight: 32%; float: left; padding-left: 1%; font-size: 80% } .panel2-measles1-auto { color: black; width: 49%; hight: 32%; float: left; padding-left: 1%; font-size: 80% } .panel3-measles1-auto { color: black; width: NA%; hight: 33%; float: left; padding-left: 1%; font-size: 80% } </style> --- count: false ## Many panels: Measles in the US example .panel1-measles2-auto[ ```r *levels <- rev(c("0", "0-1", "1-10", "10-100", "100-500", "500-1000", ">1000")) ``` ] .panel2-measles2-auto[ ] --- count: false ## Many panels: Measles in the US example .panel1-measles2-auto[ ```r levels <- rev(c("0", "0-1", "1-10", "10-100", "100-500", "500-1000", ">1000")) # Make variables into factors *measles ``` ] .panel2-measles2-auto[ ``` # A tibble: 3,876 × 4 year state count countCat <dbl> <chr> <dbl> <chr> 1 1928 Alabama 335. 100-500 2 1928 Alaska NA <NA> 3 1928 Arizona 201. 100-500 4 1928 Arkansas 482. 100-500 5 1928 California 69.2 10-100 6 1928 Colorado 207. 100-500 7 1928 Connecticut 635. 500-1000 8 1928 Delaware 256. 100-500 9 1928 District Of Columbia 536. 500-1000 10 1928 Florida 120. 100-500 # ℹ 3,866 more rows ``` ] --- count: false ## Many panels: Measles in the US example .panel1-measles2-auto[ ```r levels <- rev(c("0", "0-1", "1-10", "10-100", "100-500", "500-1000", ">1000")) # Make variables into factors measles %>% * mutate(year = factor(year), * state = factor(state), * countCat = factor(countCat, * levels = levels)) ``` ] .panel2-measles2-auto[ ``` # A tibble: 3,876 × 4 year state count countCat <fct> <fct> <dbl> <fct> 1 1928 Alabama 335. 100-500 2 1928 Alaska NA <NA> 3 1928 Arizona 201. 100-500 4 1928 Arkansas 482. 100-500 5 1928 California 69.2 10-100 6 1928 Colorado 207. 100-500 7 1928 Connecticut 635. 500-1000 8 1928 Delaware 256. 100-500 9 1928 District Of Columbia 536. 500-1000 10 1928 Florida 120. 100-500 # ℹ 3,866 more rows ``` ] --- count: false ## Many panels: Measles in the US example .panel1-measles2-auto[ ```r levels <- rev(c("0", "0-1", "1-10", "10-100", "100-500", "500-1000", ">1000")) # Make variables into factors measles %>% mutate(year = factor(year), state = factor(state), countCat = factor(countCat, levels = levels)) -> * measles ``` ] .panel2-measles2-auto[ ] <style> .panel1-measles2-auto { color: black; width: 88.2%; hight: 32%; float: top; padding-left: 1%; font-size: 80% } .panel2-measles2-auto { color: black; width: 9.8%; hight: 32%; float: top; padding-left: 1%; font-size: 80% } .panel3-measles2-auto { color: black; width: NA%; hight: 33%; float: top; padding-left: 1%; font-size: 80% } </style> --- count: false ## Many panels: Measles in the US example .panel1-measles3-auto[ ```r *ggplot(measles, aes(x = year, y = state, fill = countCat)) ``` ] .panel2-measles3-auto[ <!-- --> ] --- count: false ## Many panels: Measles in the US example .panel1-measles3-auto[ ```r ggplot(measles, aes(x = year, y = state, fill = countCat)) + * theme_cavis ``` ] .panel2-measles3-auto[ <!-- --> ] --- count: false ## Many panels: Measles in the US example .panel1-measles3-auto[ ```r ggplot(measles, aes(x = year, y = state, fill = countCat)) + theme_cavis + * geom_tile(colour = "white", size = 0.25) ``` ] .panel2-measles3-auto[ <!-- --> ] --- count: false ## Many panels: Measles in the US example .panel1-measles3-auto[ ```r ggplot(measles, aes(x = year, y = state, fill = countCat)) + theme_cavis + geom_tile(colour = "white", size = 0.25) + * scale_fill_brewer(palette = "YlGnBu", direction = -1, * na.value = "grey90") ``` ] .panel2-measles3-auto[ <!-- --> ] --- count: false ## Many panels: Measles in the US example .panel1-measles3-auto[ ```r ggplot(measles, aes(x = year, y = state, fill = countCat)) + theme_cavis + geom_tile(colour = "white", size = 0.25) + scale_fill_brewer(palette = "YlGnBu", direction = -1, na.value = "grey90") + * scale_x_discrete(expand = c(0, 0), * breaks = seq(1930, 2000, 10)) ``` ] .panel2-measles3-auto[ <!-- --> ] --- count: false ## Many panels: Measles in the US example .panel1-measles3-auto[ ```r ggplot(measles, aes(x = year, y = state, fill = countCat)) + theme_cavis + geom_tile(colour = "white", size = 0.25) + scale_fill_brewer(palette = "YlGnBu", direction = -1, na.value = "grey90") + scale_x_discrete(expand = c(0, 0), breaks = seq(1930, 2000, 10)) + * scale_y_discrete(expand = c(0, 0)) ``` ] .panel2-measles3-auto[ <!-- --> ] --- count: false ## Many panels: Measles in the US example .panel1-measles3-auto[ ```r ggplot(measles, aes(x = year, y = state, fill = countCat)) + theme_cavis + geom_tile(colour = "white", size = 0.25) + scale_fill_brewer(palette = "YlGnBu", direction = -1, na.value = "grey90") + scale_x_discrete(expand = c(0, 0), breaks = seq(1930, 2000, 10)) + scale_y_discrete(expand = c(0, 0)) + * labs(y = NULL, x = NULL) ``` ] .panel2-measles3-auto[ <!-- --> ] --- count: false ## Many panels: Measles in the US example .panel1-measles3-auto[ ```r ggplot(measles, aes(x = year, y = state, fill = countCat)) + theme_cavis + geom_tile(colour = "white", size = 0.25) + scale_fill_brewer(palette = "YlGnBu", direction = -1, na.value = "grey90") + scale_x_discrete(expand = c(0, 0), breaks = seq(1930, 2000, 10)) + scale_y_discrete(expand = c(0, 0)) + labs(y = NULL, x = NULL) + * theme(axis.text.y = element_text(size = 8), * axis.text.x = element_text(size = 8), * legend.key.height = unit(0.8, "cm"), * legend.key.width = unit(0.2, "cm")) ``` ] .panel2-measles3-auto[ <!-- --> ] <style> .panel1-measles3-auto { color: black; width: 49%; hight: 32%; float: left; padding-left: 1%; font-size: 80% } .panel2-measles3-auto { color: black; width: 49%; hight: 32%; float: left; padding-left: 1%; font-size: 80% } .panel3-measles3-auto { color: black; width: NA%; hight: 33%; float: left; padding-left: 1%; font-size: 80% } </style> --- ## Many models: 1992 Presidential Election examples - Results are estimated from an ordered probit model - Outcome: voting for Bush, Clinton, or Perot in 1992 - Key variables: variable | description --------| ----------- vote92 | Vote choice (Bush, Clinton, or Perot) rlibcon | Ideological self-placement: (1 = very liberal; 7 = very conservative) nonwhite | 0 = white, 1 = nonwhite --- count: false ## Many models: 1992 Presidential Election example .panel1-election1-auto[ ```r *presVoteEV <- read_csv("data/presVoteEV.csv") ``` ] .panel2-election1-auto[ ] --- count: false ## Many models: 1992 Presidential Election example .panel1-election1-auto[ ```r presVoteEV <- read_csv("data/presVoteEV.csv") *presVoteEV ``` ] .panel2-election1-auto[ ``` # A tibble: 42 × 6 vote92 nonwhite rlibcon pe lower upper <chr> <dbl> <dbl> <dbl> <dbl> <dbl> 1 Clinton 0 1 0.747 0.625 0.844 2 Clinton 0 2 0.649 0.543 0.742 3 Clinton 0 3 0.534 0.451 0.614 4 Clinton 0 4 0.413 0.347 0.483 5 Clinton 0 5 0.301 0.237 0.370 6 Clinton 0 6 0.209 0.144 0.283 7 Clinton 0 7 0.140 0.0800 0.219 8 Clinton 1 1 0.888 0.729 0.966 9 Clinton 1 2 0.834 0.648 0.938 10 Clinton 1 3 0.758 0.557 0.895 # ℹ 32 more rows ``` ] --- count: false ## Many models: 1992 Presidential Election example .panel1-election1-auto[ ```r presVoteEV <- read_csv("data/presVoteEV.csv") presVoteEV %>% * mutate( * nonwhite = if_else(nonwhite == 1, "Non-white", "White"), * vote92 = factor(vote92, levels = c("Clinton", "Perot", "Bush")) * ) ``` ] .panel2-election1-auto[ ``` # A tibble: 42 × 6 vote92 nonwhite rlibcon pe lower upper <fct> <chr> <dbl> <dbl> <dbl> <dbl> 1 Clinton White 1 0.747 0.625 0.844 2 Clinton White 2 0.649 0.543 0.742 3 Clinton White 3 0.534 0.451 0.614 4 Clinton White 4 0.413 0.347 0.483 5 Clinton White 5 0.301 0.237 0.370 6 Clinton White 6 0.209 0.144 0.283 7 Clinton White 7 0.140 0.0800 0.219 8 Clinton Non-white 1 0.888 0.729 0.966 9 Clinton Non-white 2 0.834 0.648 0.938 10 Clinton Non-white 3 0.758 0.557 0.895 # ℹ 32 more rows ``` ] --- count: false ## Many models: 1992 Presidential Election example .panel1-election1-auto[ ```r presVoteEV <- read_csv("data/presVoteEV.csv") presVoteEV %>% mutate( nonwhite = if_else(nonwhite == 1, "Non-white", "White"), vote92 = factor(vote92, levels = c("Clinton", "Perot", "Bush")) ) -> * presVoteEV ``` ] .panel2-election1-auto[ ] <style> .panel1-election1-auto { color: black; width: 88.2%; hight: 32%; float: top; padding-left: 1%; font-size: 80% } .panel2-election1-auto { color: black; width: 9.8%; hight: 32%; float: top; padding-left: 1%; font-size: 80% } .panel3-election1-auto { color: black; width: NA%; hight: 33%; float: top; padding-left: 1%; font-size: 80% } </style> --- count: false ## Many models: 1992 Presidential Election example .panel1-election2-auto[ ```r *ggplot(presVoteEV, * aes(x = rlibcon, y = pe, ymax = upper, ymin = lower)) ``` ] .panel2-election2-auto[ <!-- --> ] --- count: false ## Many models: 1992 Presidential Election example .panel1-election2-auto[ ```r ggplot(presVoteEV, aes(x = rlibcon, y = pe, ymax = upper, ymin = lower)) + * theme_cavis_hgrid ``` ] .panel2-election2-auto[ <!-- --> ] --- count: false ## Many models: 1992 Presidential Election example .panel1-election2-auto[ ```r ggplot(presVoteEV, aes(x = rlibcon, y = pe, ymax = upper, ymin = lower)) + theme_cavis_hgrid + * facet_grid(nonwhite ~ vote92) ``` ] .panel2-election2-auto[ <!-- --> ] --- count: false ## Many models: 1992 Presidential Election example .panel1-election2-auto[ ```r ggplot(presVoteEV, aes(x = rlibcon, y = pe, ymax = upper, ymin = lower)) + theme_cavis_hgrid + facet_grid(nonwhite ~ vote92) + * geom_line() ``` ] .panel2-election2-auto[ <!-- --> ] --- count: false ## Many models: 1992 Presidential Election example .panel1-election2-auto[ ```r ggplot(presVoteEV, aes(x = rlibcon, y = pe, ymax = upper, ymin = lower)) + theme_cavis_hgrid + facet_grid(nonwhite ~ vote92) + geom_line() + * geom_ribbon(alpha = 0.25, linetype = 0) ``` ] .panel2-election2-auto[ <!-- --> ] <style> .panel1-election2-auto { color: black; width: 49%; hight: 32%; float: left; padding-left: 1%; font-size: 80% } .panel2-election2-auto { color: black; width: 49%; hight: 32%; float: left; padding-left: 1%; font-size: 80% } .panel3-election2-auto { color: black; width: NA%; hight: 33%; float: left; padding-left: 1%; font-size: 80% } </style> --- count: false ## Many models: 1992 Presidential Election example .panel1-election3-auto[ ```r *ggplot(presVoteEV, * aes(x = rlibcon, y = pe, ymax = upper, ymin = lower, * color = nonwhite, fill = nonwhite)) ``` ] .panel2-election3-auto[ <!-- --> ] --- count: false ## Many models: 1992 Presidential Election example .panel1-election3-auto[ ```r ggplot(presVoteEV, aes(x = rlibcon, y = pe, ymax = upper, ymin = lower, color = nonwhite, fill = nonwhite)) + * theme_cavis_hgrid ``` ] .panel2-election3-auto[ <!-- --> ] --- count: false ## Many models: 1992 Presidential Election example .panel1-election3-auto[ ```r ggplot(presVoteEV, aes(x = rlibcon, y = pe, ymax = upper, ymin = lower, color = nonwhite, fill = nonwhite)) + theme_cavis_hgrid + * facet_grid(~ vote92) ``` ] .panel2-election3-auto[ <!-- --> ] --- count: false ## Many models: 1992 Presidential Election example .panel1-election3-auto[ ```r ggplot(presVoteEV, aes(x = rlibcon, y = pe, ymax = upper, ymin = lower, color = nonwhite, fill = nonwhite)) + theme_cavis_hgrid + facet_grid(~ vote92) + * geom_line() ``` ] .panel2-election3-auto[ <!-- --> ] --- count: false ## Many models: 1992 Presidential Election example .panel1-election3-auto[ ```r ggplot(presVoteEV, aes(x = rlibcon, y = pe, ymax = upper, ymin = lower, color = nonwhite, fill = nonwhite)) + theme_cavis_hgrid + facet_grid(~ vote92) + geom_line() + * scale_color_manual(values = c(orange, blue)) ``` ] .panel2-election3-auto[ <!-- --> ] --- count: false ## Many models: 1992 Presidential Election example .panel1-election3-auto[ ```r ggplot(presVoteEV, aes(x = rlibcon, y = pe, ymax = upper, ymin = lower, color = nonwhite, fill = nonwhite)) + theme_cavis_hgrid + facet_grid(~ vote92) + geom_line() + scale_color_manual(values = c(orange, blue)) + * geom_ribbon(alpha = 0.25, linetype = 0, show.legend = FALSE) ``` ] .panel2-election3-auto[ <!-- --> ] --- count: false ## Many models: 1992 Presidential Election example .panel1-election3-auto[ ```r ggplot(presVoteEV, aes(x = rlibcon, y = pe, ymax = upper, ymin = lower, color = nonwhite, fill = nonwhite)) + theme_cavis_hgrid + facet_grid(~ vote92) + geom_line() + scale_color_manual(values = c(orange, blue)) + geom_ribbon(alpha = 0.25, linetype = 0, show.legend = FALSE) + * scale_fill_manual(values = c(0, blue)) ``` ] .panel2-election3-auto[ <!-- --> ] --- count: false ## Many models: 1992 Presidential Election example .panel1-election3-auto[ ```r ggplot(presVoteEV, aes(x = rlibcon, y = pe, ymax = upper, ymin = lower, color = nonwhite, fill = nonwhite)) + theme_cavis_hgrid + facet_grid(~ vote92) + geom_line() + scale_color_manual(values = c(orange, blue)) + geom_ribbon(alpha = 0.25, linetype = 0, show.legend = FALSE) + scale_fill_manual(values = c(0, blue)) + * geom_line(aes(y = upper, linetype = nonwhite)) ``` ] .panel2-election3-auto[ <!-- --> ] --- count: false ## Many models: 1992 Presidential Election example .panel1-election3-auto[ ```r ggplot(presVoteEV, aes(x = rlibcon, y = pe, ymax = upper, ymin = lower, color = nonwhite, fill = nonwhite)) + theme_cavis_hgrid + facet_grid(~ vote92) + geom_line() + scale_color_manual(values = c(orange, blue)) + geom_ribbon(alpha = 0.25, linetype = 0, show.legend = FALSE) + scale_fill_manual(values = c(0, blue)) + geom_line(aes(y = upper, linetype = nonwhite)) + * geom_line(aes(y = lower, linetype = nonwhite)) ``` ] .panel2-election3-auto[ <!-- --> ] --- count: false ## Many models: 1992 Presidential Election example .panel1-election3-auto[ ```r ggplot(presVoteEV, aes(x = rlibcon, y = pe, ymax = upper, ymin = lower, color = nonwhite, fill = nonwhite)) + theme_cavis_hgrid + facet_grid(~ vote92) + geom_line() + scale_color_manual(values = c(orange, blue)) + geom_ribbon(alpha = 0.25, linetype = 0, show.legend = FALSE) + scale_fill_manual(values = c(0, blue)) + geom_line(aes(y = upper, linetype = nonwhite)) + geom_line(aes(y = lower, linetype = nonwhite)) + * scale_linetype_manual(values = c(2, 0)) ``` ] .panel2-election3-auto[ <!-- --> ] --- count: false ## Many models: 1992 Presidential Election example .panel1-election3-auto[ ```r ggplot(presVoteEV, aes(x = rlibcon, y = pe, ymax = upper, ymin = lower, color = nonwhite, fill = nonwhite)) + theme_cavis_hgrid + facet_grid(~ vote92) + geom_line() + scale_color_manual(values = c(orange, blue)) + geom_ribbon(alpha = 0.25, linetype = 0, show.legend = FALSE) + scale_fill_manual(values = c(0, blue)) + geom_line(aes(y = upper, linetype = nonwhite)) + geom_line(aes(y = lower, linetype = nonwhite)) + scale_linetype_manual(values = c(2, 0)) + * scale_x_continuous(breaks = seq(1, 7, 2)) ``` ] .panel2-election3-auto[ <!-- --> ] --- count: false ## Many models: 1992 Presidential Election example .panel1-election3-auto[ ```r ggplot(presVoteEV, aes(x = rlibcon, y = pe, ymax = upper, ymin = lower, color = nonwhite, fill = nonwhite)) + theme_cavis_hgrid + facet_grid(~ vote92) + geom_line() + scale_color_manual(values = c(orange, blue)) + geom_ribbon(alpha = 0.25, linetype = 0, show.legend = FALSE) + scale_fill_manual(values = c(0, blue)) + geom_line(aes(y = upper, linetype = nonwhite)) + geom_line(aes(y = lower, linetype = nonwhite)) + scale_linetype_manual(values = c(2, 0)) + scale_x_continuous(breaks = seq(1, 7, 2)) + * scale_y_continuous(labels = label_percent(), * breaks = seq(0, 1, 0.25), * limits = c(0, 1), * expand = c(0, 0)) ``` ] .panel2-election3-auto[ <!-- --> ] --- count: false ## Many models: 1992 Presidential Election example .panel1-election3-auto[ ```r ggplot(presVoteEV, aes(x = rlibcon, y = pe, ymax = upper, ymin = lower, color = nonwhite, fill = nonwhite)) + theme_cavis_hgrid + facet_grid(~ vote92) + geom_line() + scale_color_manual(values = c(orange, blue)) + geom_ribbon(alpha = 0.25, linetype = 0, show.legend = FALSE) + scale_fill_manual(values = c(0, blue)) + geom_line(aes(y = upper, linetype = nonwhite)) + geom_line(aes(y = lower, linetype = nonwhite)) + scale_linetype_manual(values = c(2, 0)) + scale_x_continuous(breaks = seq(1, 7, 2)) + scale_y_continuous(labels = label_percent(), breaks = seq(0, 1, 0.25), limits = c(0, 1), expand = c(0, 0)) + * theme(legend.position = c(0.05, 0.15)) ``` ] .panel2-election3-auto[ <!-- --> ] --- count: false ## Many models: 1992 Presidential Election example .panel1-election3-auto[ ```r ggplot(presVoteEV, aes(x = rlibcon, y = pe, ymax = upper, ymin = lower, color = nonwhite, fill = nonwhite)) + theme_cavis_hgrid + facet_grid(~ vote92) + geom_line() + scale_color_manual(values = c(orange, blue)) + geom_ribbon(alpha = 0.25, linetype = 0, show.legend = FALSE) + scale_fill_manual(values = c(0, blue)) + geom_line(aes(y = upper, linetype = nonwhite)) + geom_line(aes(y = lower, linetype = nonwhite)) + scale_linetype_manual(values = c(2, 0)) + scale_x_continuous(breaks = seq(1, 7, 2)) + scale_y_continuous(labels = label_percent(), breaks = seq(0, 1, 0.25), limits = c(0, 1), expand = c(0, 0)) + theme(legend.position = c(0.05, 0.15)) + * labs(y = "Predicted prob. of voting", * x = "Ideological self-placement") ``` ] .panel2-election3-auto[ <!-- --> ] <style> .panel1-election3-auto { color: black; width: 49%; hight: 32%; float: left; padding-left: 1%; font-size: 80% } .panel2-election3-auto { color: black; width: 49%; hight: 32%; float: left; padding-left: 1%; font-size: 80% } .panel3-election3-auto { color: black; width: NA%; hight: 33%; float: left; padding-left: 1%; font-size: 80% } </style> --- ## Many models: Cy Young award examples - Background: North American baseball pitchers from 1980 to 2002 competing for the Cy Young Award -- - Outcome: binary; winning the Cy Young Award or not -- - Results are estimated from logistic regression -- - Key variables: variable | description --------| ----------- winpct | Percentage of games which the pitcher personally won era | Number of runs the pitcher allows per 9 innings strikeout | Number of strikeouts the pitcher collected over a season innings | Number of innings (periods) a pitcher played during the season walks | Number of walks the pitcher collected over a season pe | First difference in expected prob. of winning given some change in covariate lower & upper| Lower & upper bound of the 95% confidence intervals --- count: false ## Many models: Cy Young award example .panel1-cyyoung1-auto[ ```r *cyYoungFD <- read_csv("data/cyyoungFD.csv") ``` ] .panel2-cyyoung1-auto[ ] --- count: false ## Many models: Cy Young award example .panel1-cyyoung1-auto[ ```r cyYoungFD <- read_csv("data/cyyoungFD.csv") *cyYoungFD ``` ] .panel2-cyyoung1-auto[ ``` # A tibble: 5 × 7 covariate pe_m1 lower_m1 upper_m1 pe_m2 lower_m2 upper_m2 <chr> <dbl> <dbl> <dbl> <dbl> <dbl> <dbl> 1 winpct 0.342 0.192 0.484 0.198 0.111 0.280 2 era -0.599 -0.749 -0.314 -0.347 -0.434 -0.182 3 strikeout 0.223 -0.0793 0.403 0.129 -0.0459 0.233 4 innings 0.277 -0.437 0.465 0.160 -0.253 0.269 5 walks 0.0808 -0.299 0.320 0.0468 -0.173 0.185 ``` ] --- count: false ## Many models: Cy Young award example .panel1-cyyoung1-auto[ ```r cyYoungFD <- read_csv("data/cyyoungFD.csv") cyYoungFD %>% * pivot_longer(cols = pe_m1:upper_m2, names_to = "col_names", values_to = "value") ``` ] .panel2-cyyoung1-auto[ ``` # A tibble: 30 × 3 covariate col_names value <chr> <chr> <dbl> 1 winpct pe_m1 0.342 2 winpct lower_m1 0.192 3 winpct upper_m1 0.484 4 winpct pe_m2 0.198 5 winpct lower_m2 0.111 6 winpct upper_m2 0.280 7 era pe_m1 -0.599 8 era lower_m1 -0.749 9 era upper_m1 -0.314 10 era pe_m2 -0.347 # ℹ 20 more rows ``` ] --- count: false ## Many models: Cy Young award example .panel1-cyyoung1-auto[ ```r cyYoungFD <- read_csv("data/cyyoungFD.csv") cyYoungFD %>% pivot_longer(cols = pe_m1:upper_m2, names_to = "col_names", values_to = "value") %>% * separate(col_names, into = c("stat", "model"), sep = "_") ``` ] .panel2-cyyoung1-auto[ ``` # A tibble: 30 × 4 covariate stat model value <chr> <chr> <chr> <dbl> 1 winpct pe m1 0.342 2 winpct lower m1 0.192 3 winpct upper m1 0.484 4 winpct pe m2 0.198 5 winpct lower m2 0.111 6 winpct upper m2 0.280 7 era pe m1 -0.599 8 era lower m1 -0.749 9 era upper m1 -0.314 10 era pe m2 -0.347 # ℹ 20 more rows ``` ] --- count: false ## Many models: Cy Young award example .panel1-cyyoung1-auto[ ```r cyYoungFD <- read_csv("data/cyyoungFD.csv") cyYoungFD %>% pivot_longer(cols = pe_m1:upper_m2, names_to = "col_names", values_to = "value") %>% separate(col_names, into = c("stat", "model"), sep = "_") %>% * pivot_wider(names_from = stat, values_from = value) ``` ] .panel2-cyyoung1-auto[ ``` # A tibble: 10 × 5 covariate model pe lower upper <chr> <chr> <dbl> <dbl> <dbl> 1 winpct m1 0.342 0.192 0.484 2 winpct m2 0.198 0.111 0.280 3 era m1 -0.599 -0.749 -0.314 4 era m2 -0.347 -0.434 -0.182 5 strikeout m1 0.223 -0.0793 0.403 6 strikeout m2 0.129 -0.0459 0.233 7 innings m1 0.277 -0.437 0.465 8 innings m2 0.160 -0.253 0.269 9 walks m1 0.0808 -0.299 0.320 10 walks m2 0.0468 -0.173 0.185 ``` ] --- count: false ## Many models: Cy Young award example .panel1-cyyoung1-auto[ ```r cyYoungFD <- read_csv("data/cyyoungFD.csv") cyYoungFD %>% pivot_longer(cols = pe_m1:upper_m2, names_to = "col_names", values_to = "value") %>% separate(col_names, into = c("stat", "model"), sep = "_") %>% pivot_wider(names_from = stat, values_from = value) %>% * mutate(signif = case_when(lower > 0 & upper > 0 ~ TRUE, * lower < 0 & upper < 0 ~ TRUE, * TRUE ~ FALSE)) ``` ] .panel2-cyyoung1-auto[ ``` # A tibble: 10 × 6 covariate model pe lower upper signif <chr> <chr> <dbl> <dbl> <dbl> <lgl> 1 winpct m1 0.342 0.192 0.484 TRUE 2 winpct m2 0.198 0.111 0.280 TRUE 3 era m1 -0.599 -0.749 -0.314 TRUE 4 era m2 -0.347 -0.434 -0.182 TRUE 5 strikeout m1 0.223 -0.0793 0.403 FALSE 6 strikeout m2 0.129 -0.0459 0.233 FALSE 7 innings m1 0.277 -0.437 0.465 FALSE 8 innings m2 0.160 -0.253 0.269 FALSE 9 walks m1 0.0808 -0.299 0.320 FALSE 10 walks m2 0.0468 -0.173 0.185 FALSE ``` ] --- count: false ## Many models: Cy Young award example .panel1-cyyoung1-auto[ ```r cyYoungFD <- read_csv("data/cyyoungFD.csv") cyYoungFD %>% pivot_longer(cols = pe_m1:upper_m2, names_to = "col_names", values_to = "value") %>% separate(col_names, into = c("stat", "model"), sep = "_") %>% pivot_wider(names_from = stat, values_from = value) %>% mutate(signif = case_when(lower > 0 & upper > 0 ~ TRUE, lower < 0 & upper < 0 ~ TRUE, TRUE ~ FALSE)) -> * cyYoungFD ``` ] .panel2-cyyoung1-auto[ ] <style> .panel1-cyyoung1-auto { color: black; width: 88.2%; hight: 32%; float: top; padding-left: 1%; font-size: 80% } .panel2-cyyoung1-auto { color: black; width: 9.8%; hight: 32%; float: top; padding-left: 1%; font-size: 80% } .panel3-cyyoung1-auto { color: black; width: NA%; hight: 33%; float: top; padding-left: 1%; font-size: 80% } </style> --- count: false ## Many models: Cy Young award example .panel1-cyyoung2-auto[ ```r *ggplot(cyYoungFD, * aes(y = fct_reorder(covariate, pe, .desc = TRUE), * x = pe, xmax = upper, xmin = lower, * color = model, shape = signif, fill = signif)) ``` ] .panel2-cyyoung2-auto[ <!-- --> ] --- count: false ## Many models: Cy Young award example .panel1-cyyoung2-auto[ ```r ggplot(cyYoungFD, aes(y = fct_reorder(covariate, pe, .desc = TRUE), x = pe, xmax = upper, xmin = lower, color = model, shape = signif, fill = signif)) + * theme_cavis_vgrid ``` ] .panel2-cyyoung2-auto[ <!-- --> ] --- count: false ## Many models: Cy Young award example .panel1-cyyoung2-auto[ ```r ggplot(cyYoungFD, aes(y = fct_reorder(covariate, pe, .desc = TRUE), x = pe, xmax = upper, xmin = lower, color = model, shape = signif, fill = signif)) + theme_cavis_vgrid + * geom_vline(xintercept = 0, linetype = 2, color = "grey45") ``` ] .panel2-cyyoung2-auto[ <!-- --> ] --- count: false ## Many models: Cy Young award example .panel1-cyyoung2-auto[ ```r ggplot(cyYoungFD, aes(y = fct_reorder(covariate, pe, .desc = TRUE), x = pe, xmax = upper, xmin = lower, color = model, shape = signif, fill = signif)) + theme_cavis_vgrid + geom_vline(xintercept = 0, linetype = 2, color = "grey45") + * geom_pointrangeh(position = position_dodge2v(height = 0.5)) ``` ] .panel2-cyyoung2-auto[ <!-- --> ] --- count: false ## Many models: Cy Young award example .panel1-cyyoung2-auto[ ```r ggplot(cyYoungFD, aes(y = fct_reorder(covariate, pe, .desc = TRUE), x = pe, xmax = upper, xmin = lower, color = model, shape = signif, fill = signif)) + theme_cavis_vgrid + geom_vline(xintercept = 0, linetype = 2, color = "grey45") + geom_pointrangeh(position = position_dodge2v(height = 0.5)) + * scale_colour_manual(values = c(blue, orange), * labels = c("Model 1", "Model 2")) ``` ] .panel2-cyyoung2-auto[ <!-- --> ] --- count: false ## Many models: Cy Young award example .panel1-cyyoung2-auto[ ```r ggplot(cyYoungFD, aes(y = fct_reorder(covariate, pe, .desc = TRUE), x = pe, xmax = upper, xmin = lower, color = model, shape = signif, fill = signif)) + theme_cavis_vgrid + geom_vline(xintercept = 0, linetype = 2, color = "grey45") + geom_pointrangeh(position = position_dodge2v(height = 0.5)) + scale_colour_manual(values = c(blue, orange), labels = c("Model 1", "Model 2")) + * scale_shape_manual(values = c(21, 19)) ``` ] .panel2-cyyoung2-auto[ <!-- --> ] --- count: false ## Many models: Cy Young award example .panel1-cyyoung2-auto[ ```r ggplot(cyYoungFD, aes(y = fct_reorder(covariate, pe, .desc = TRUE), x = pe, xmax = upper, xmin = lower, color = model, shape = signif, fill = signif)) + theme_cavis_vgrid + geom_vline(xintercept = 0, linetype = 2, color = "grey45") + geom_pointrangeh(position = position_dodge2v(height = 0.5)) + scale_colour_manual(values = c(blue, orange), labels = c("Model 1", "Model 2")) + scale_shape_manual(values = c(21, 19)) + * scale_fill_manual(values = c("white", NA)) ``` ] .panel2-cyyoung2-auto[ <!-- --> ] --- count: false ## Many models: Cy Young award example .panel1-cyyoung2-auto[ ```r ggplot(cyYoungFD, aes(y = fct_reorder(covariate, pe, .desc = TRUE), x = pe, xmax = upper, xmin = lower, color = model, shape = signif, fill = signif)) + theme_cavis_vgrid + geom_vline(xintercept = 0, linetype = 2, color = "grey45") + geom_pointrangeh(position = position_dodge2v(height = 0.5)) + scale_colour_manual(values = c(blue, orange), labels = c("Model 1", "Model 2")) + scale_shape_manual(values = c(21, 19)) + scale_fill_manual(values = c("white", NA)) + * scale_x_continuous(sec.axis = dup_axis(name = NULL), * labels = label_percent()) ``` ] .panel2-cyyoung2-auto[ <!-- --> ] --- count: false ## Many models: Cy Young award example .panel1-cyyoung2-auto[ ```r ggplot(cyYoungFD, aes(y = fct_reorder(covariate, pe, .desc = TRUE), x = pe, xmax = upper, xmin = lower, color = model, shape = signif, fill = signif)) + theme_cavis_vgrid + geom_vline(xintercept = 0, linetype = 2, color = "grey45") + geom_pointrangeh(position = position_dodge2v(height = 0.5)) + scale_colour_manual(values = c(blue, orange), labels = c("Model 1", "Model 2")) + scale_shape_manual(values = c(21, 19)) + scale_fill_manual(values = c("white", NA)) + scale_x_continuous(sec.axis = dup_axis(name = NULL), labels = label_percent()) + * geom_text(data = filter(cyYoungFD, covariate == "era"), * aes(label = c("Model 1", "Model 2")), * position = position_dodge2v(height = 1.25)) ``` ] .panel2-cyyoung2-auto[ <!-- --> ] --- count: false ## Many models: Cy Young award example .panel1-cyyoung2-auto[ ```r ggplot(cyYoungFD, aes(y = fct_reorder(covariate, pe, .desc = TRUE), x = pe, xmax = upper, xmin = lower, color = model, shape = signif, fill = signif)) + theme_cavis_vgrid + geom_vline(xintercept = 0, linetype = 2, color = "grey45") + geom_pointrangeh(position = position_dodge2v(height = 0.5)) + scale_colour_manual(values = c(blue, orange), labels = c("Model 1", "Model 2")) + scale_shape_manual(values = c(21, 19)) + scale_fill_manual(values = c("white", NA)) + scale_x_continuous(sec.axis = dup_axis(name = NULL), labels = label_percent()) + geom_text(data = filter(cyYoungFD, covariate == "era"), aes(label = c("Model 1", "Model 2")), position = position_dodge2v(height = 1.25)) + * theme(legend.position = "none") ``` ] .panel2-cyyoung2-auto[ <!-- --> ] --- count: false ## Many models: Cy Young award example .panel1-cyyoung2-auto[ ```r ggplot(cyYoungFD, aes(y = fct_reorder(covariate, pe, .desc = TRUE), x = pe, xmax = upper, xmin = lower, color = model, shape = signif, fill = signif)) + theme_cavis_vgrid + geom_vline(xintercept = 0, linetype = 2, color = "grey45") + geom_pointrangeh(position = position_dodge2v(height = 0.5)) + scale_colour_manual(values = c(blue, orange), labels = c("Model 1", "Model 2")) + scale_shape_manual(values = c(21, 19)) + scale_fill_manual(values = c("white", NA)) + scale_x_continuous(sec.axis = dup_axis(name = NULL), labels = label_percent()) + geom_text(data = filter(cyYoungFD, covariate == "era"), aes(label = c("Model 1", "Model 2")), position = position_dodge2v(height = 1.25)) + theme(legend.position = "none") + * labs(x = "Difference in predicted prob. in winning Cy Young", * y = NULL) ``` ] .panel2-cyyoung2-auto[ <!-- --> ] <style> .panel1-cyyoung2-auto { color: black; width: 49%; hight: 32%; float: left; padding-left: 1%; font-size: 80% } .panel2-cyyoung2-auto { color: black; width: 49%; hight: 32%; float: left; padding-left: 1%; font-size: 80% } .panel3-cyyoung2-auto { color: black; width: NA%; hight: 33%; float: left; padding-left: 1%; font-size: 80% } </style>