
By Tom Dobrowolsky, MLIS Day
Cry "graphic!" and let slip the diagrams of fluffy social science!
Colleagues,
Many people, especially that sinister lot of you who were English majors, have this erroneous idea of the "hard sciences" as the province of tedious quantitation, numbing statistical analysis, hazardous fluids, assorted beakers, and glowing test tubes. Well, coming from a geologic and natural science background, I can tell you that you could not be further from the truth! The natural sciences, for example, are all about eating soil, drinking beer, precise measurements, charts & tables & statistics, dangerous liquids, miscellaneous vessels and iridescent test tubes.
You may ask: but, dearest komrade Kommissar, why must you speak of such foreign disciplines in our fluffy, humanistic realm? Well, young gazelle, in the list above, the one characteristic of the "hard sciences" that I left out... the only thing cooler than savoring the silky taste of silty clay loam... is the resplendent abundance of diagrams, maps, and various drawings in the scientific literature. Allow me to explain.
Friends, the social sciences have attempted to gain acceptance among the other sciences in the wrong ways. You see, in an effort to appear thorough and empirical and legitimate - mistakenly defined as scientific - in order to justify living next door to the other sciences, social sciences have adopted some of their neighbors' methods and paradigms. Some of these methodologies I have no use for, while others I whole-heartedly embrace. It is for this reason, good scientists, that I write you today.
Leave that filthy quantitative nonsense to the chemists and the physicists! More respect and wide-spread acceptance of our intellectual worth can be garnered by the generation of pretty and informative diagrams than could ever be gained from even the most meticulous ANOVA.
Friends, let loose the academic comics!
I mean, who doesn't enjoy a simple, graphic representation to illustrate a complex and weighty principle? Pick up any basic text on geology or ecology. What philistine among you would not enjoy a full-color diagram of the hydrologic cycle, say, or a detailed stratigraphic column of deltaic sedimentary deposits? Informative and entertaining, no? Pictures are the best mental decongestant!
Thus, in this issue dedicated to comics, I encourage you to take up pencil and paper and draw some diagrams! Just think how much clearer your paper comparing two models of information behavior would be had you thrown in a few well-placed diagrams. We secretly talk of "padding" our papers as if our professors were unaware of this time-honored practice. But take a page from their own papers: fluffy diagrams reduce obfuscation by explicating convoluted and labored academic verbiage. They are the best padding!
You say you have no artistic ability? None needed, friends! Can you draw a basic stick figure to represent a user? Can you draw boxes and write words in them? Good work!
For those still daft on the concept, however, I offer the following instructions, which I adapted from http://www.summer.uncc.edu/webcamp/patel/DAP2.htm:
- Draw a line; this is the body.
- At one end of the line, draw a circle. This will represent the head.
- Inside the circle, draw two dots. Under them, draw a short line perpendicular to the body line that you drew. These represent the eyes and mouth, respectively. Add eyebrows and/or curve the mouth line appropriately to convey mood.
- At the end opposite the head, draw a V with the point connecting to the body line. This represents the legs -- the point of the V represents your stick figure's naughty bits, which you may wish to disguise with simple clothing to retain modesty.
- Somewhere between the head and the naughty bits, draw a line coming out from each side of the body line. These are the arms.
- Add hair and accoutrements as you desire and as your artistic ability improves.
You can now add explanatory text, text in boxes, word balloons, and/or personal effects from your stick figure's world (a hair brush is a powerful symbol, for some reason). These items may represent concepts, tools, or states of being. Connect objects and text with arrows; these represent processes and relationships between items. You may label your arrows appropriately with text that either identifies the name of the process or describes what is happening. When you master this, you can even try to add a second panel to your diagram!
Simple, isn't it? Furthermore, the beauty of social science diagrams is that most of them are abstract. Unlike a map or a soil profile, for example, your diagrams needn't trifle with proper scale or correct position with respect to the real world. Remember, you are drawing a conceptual map to navigate the squishy and imprecise world of the mind and human relations rather than the concrete and precise actual world. Whereas an imprecise map, for example, can invalidate its underlying scientific logic, an imprecise social science diagram will not significantly alter the incomprehension of an already confusing theory!
Take, for example, this fluffy social science diagram I drew for a short presentation on the confusing subject of hermeneutics:
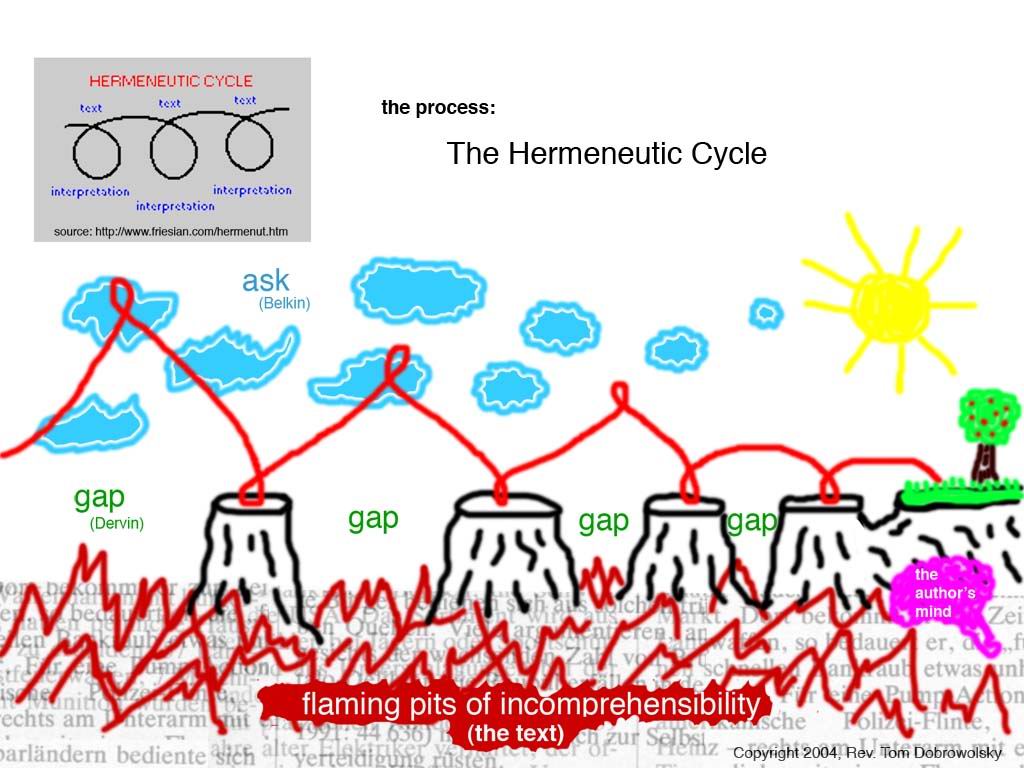
Like any diagram, it is by no means completely accurate (it's likely not even true). However, it does illustrate the notion that with a little bit of flair you can make some really pretty diagrams to illustrate some otherwise dry and weighty philosophies. Not all academic knowledge needs to be composed of simple line drawings on a dichromatic palette, after all.
"Sophistry!" you might cry. Yes, guilty! But The People to whom we are beholden like pretty pictures.
Now, what with all this drawing, you might ask yourselves whether or not this will further marginalize social sciences. One can only imagine some high-browed astro-physicist dismissing the latest bleeding edge LIS theory as so much rubbish due to its churlish scrawlings and simple diagrams having no basis in reality. Well, she'd be correct; this ain't hard science, after all. And bully for that, I say! As a layperson, what would you rather read about: the amount of nitrogenous gases in a far-off nebula that you'll never see or the way in which people in a bar trade information and subsequently shack up for the evening?
Besides, if you can't inform, at least you can entertain.